Home
Browsing Animations: Momentum, Collisions, KE
23 Animations
auto-impulse-3.iwp
A car and its unseatbelted crash test dummy accelerates uniformly from rest toward an immovable wall. The car bounces off the wall and then decelerates uniformly to a stop. Click Show Graph to display a graph of the velocity of the car vs. time.
auto-impulse-compare.iwp
Two cars of equal mass and initial velocity to the right collide with a wall. One car is stopped in the collision and the other bounces off the wall with a velocity of smaller magnitude than it struck the wall. Which car experiences the greater average force of impact in the collision with the wall?
collision-01.iwp
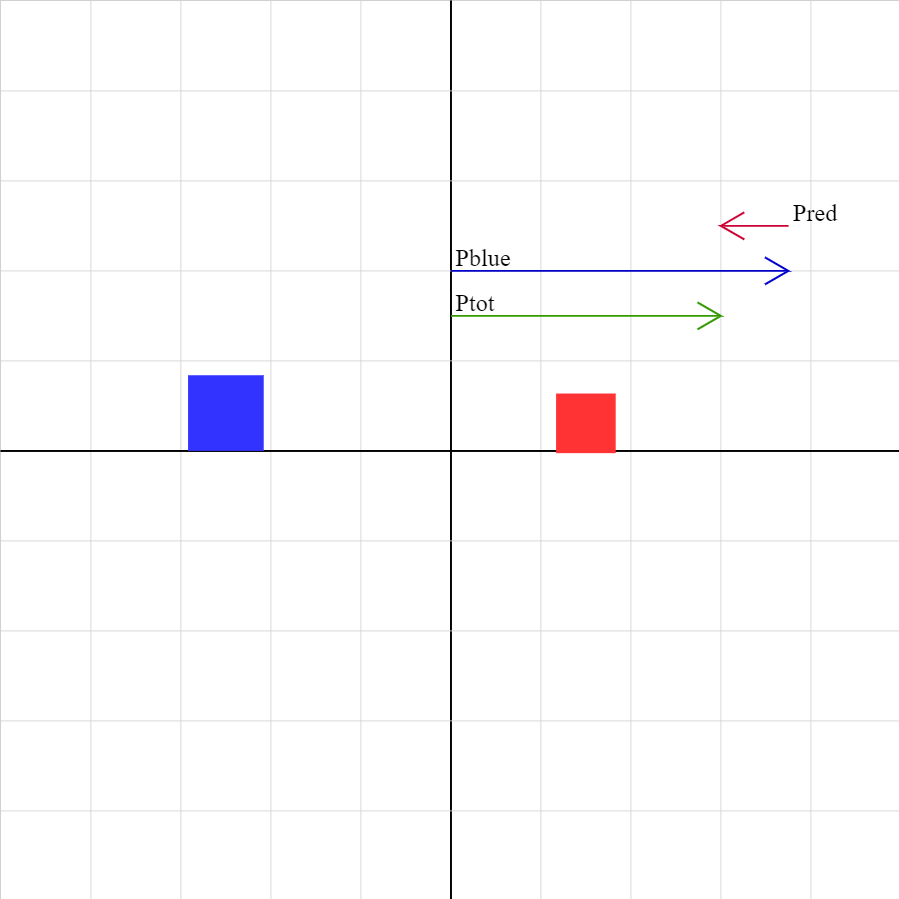
Two objects collide and rebound from each other. The momentum vector of each object as well as the sum of the momentum vectors is displayed. The lengths of the vectors are drawn to the same scale. Unphysical results may be obtained for combinations of initial velocities for which the objects cannot collide.
collision-02.iwp
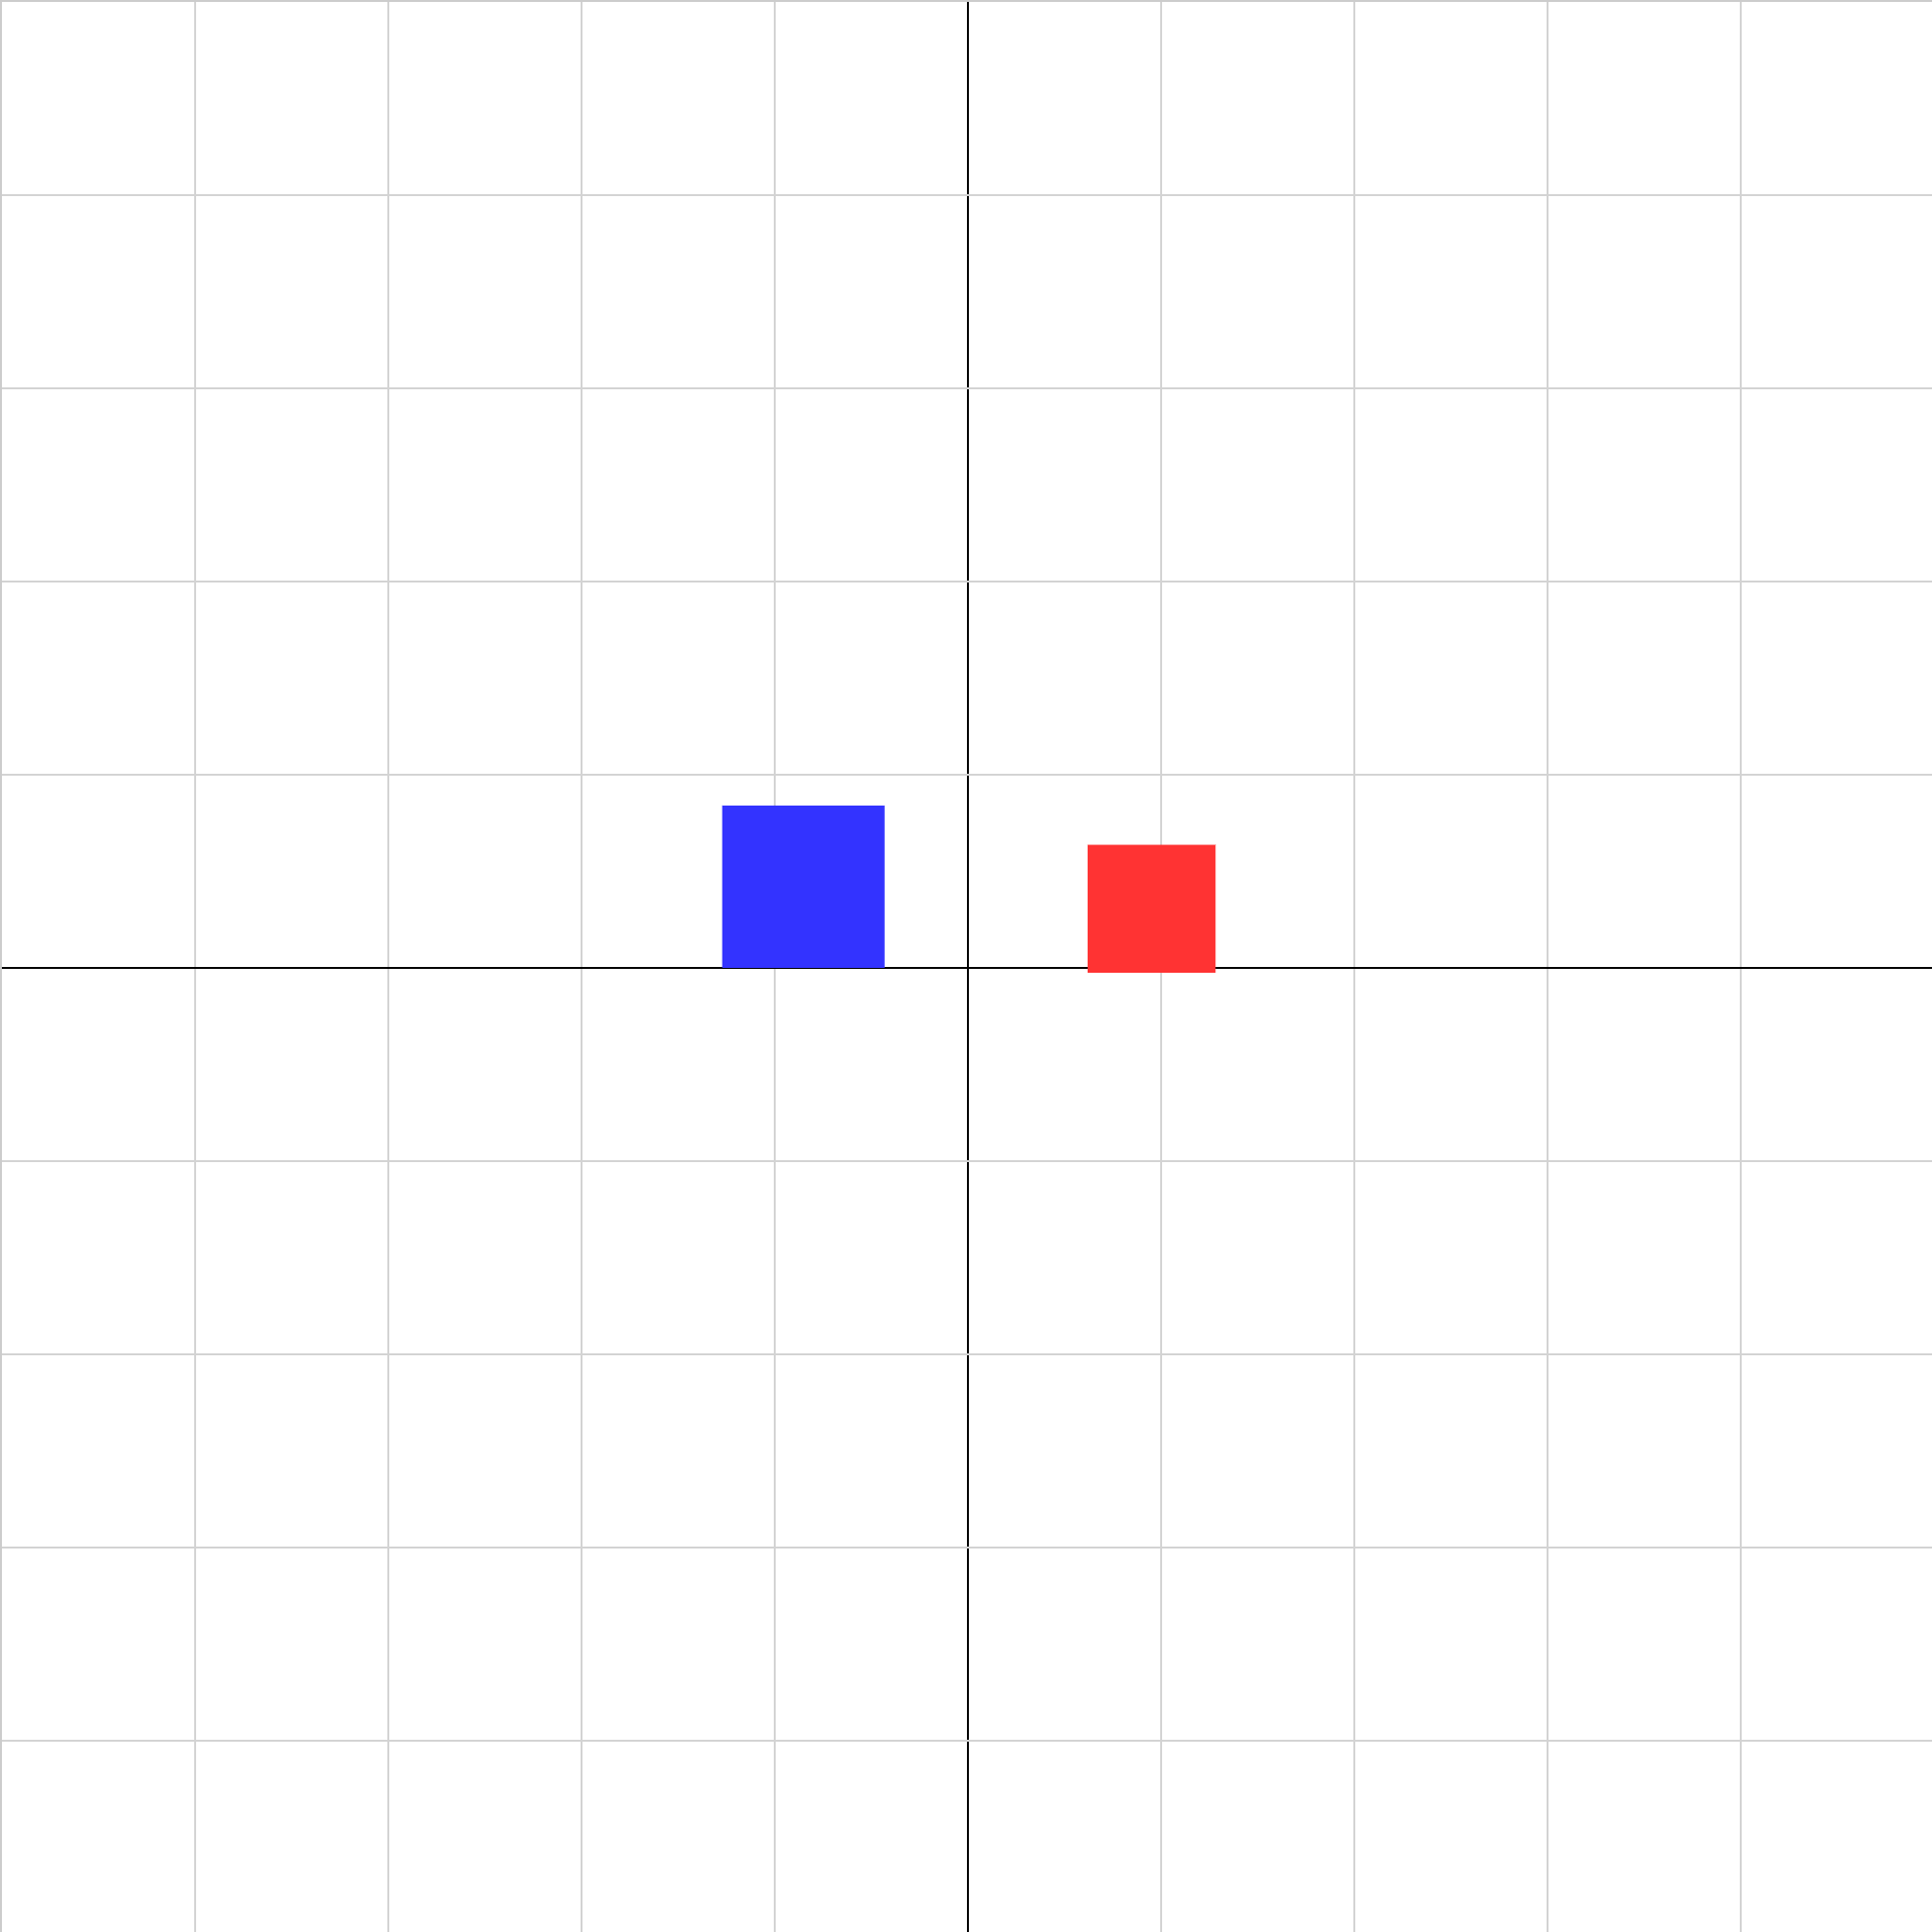
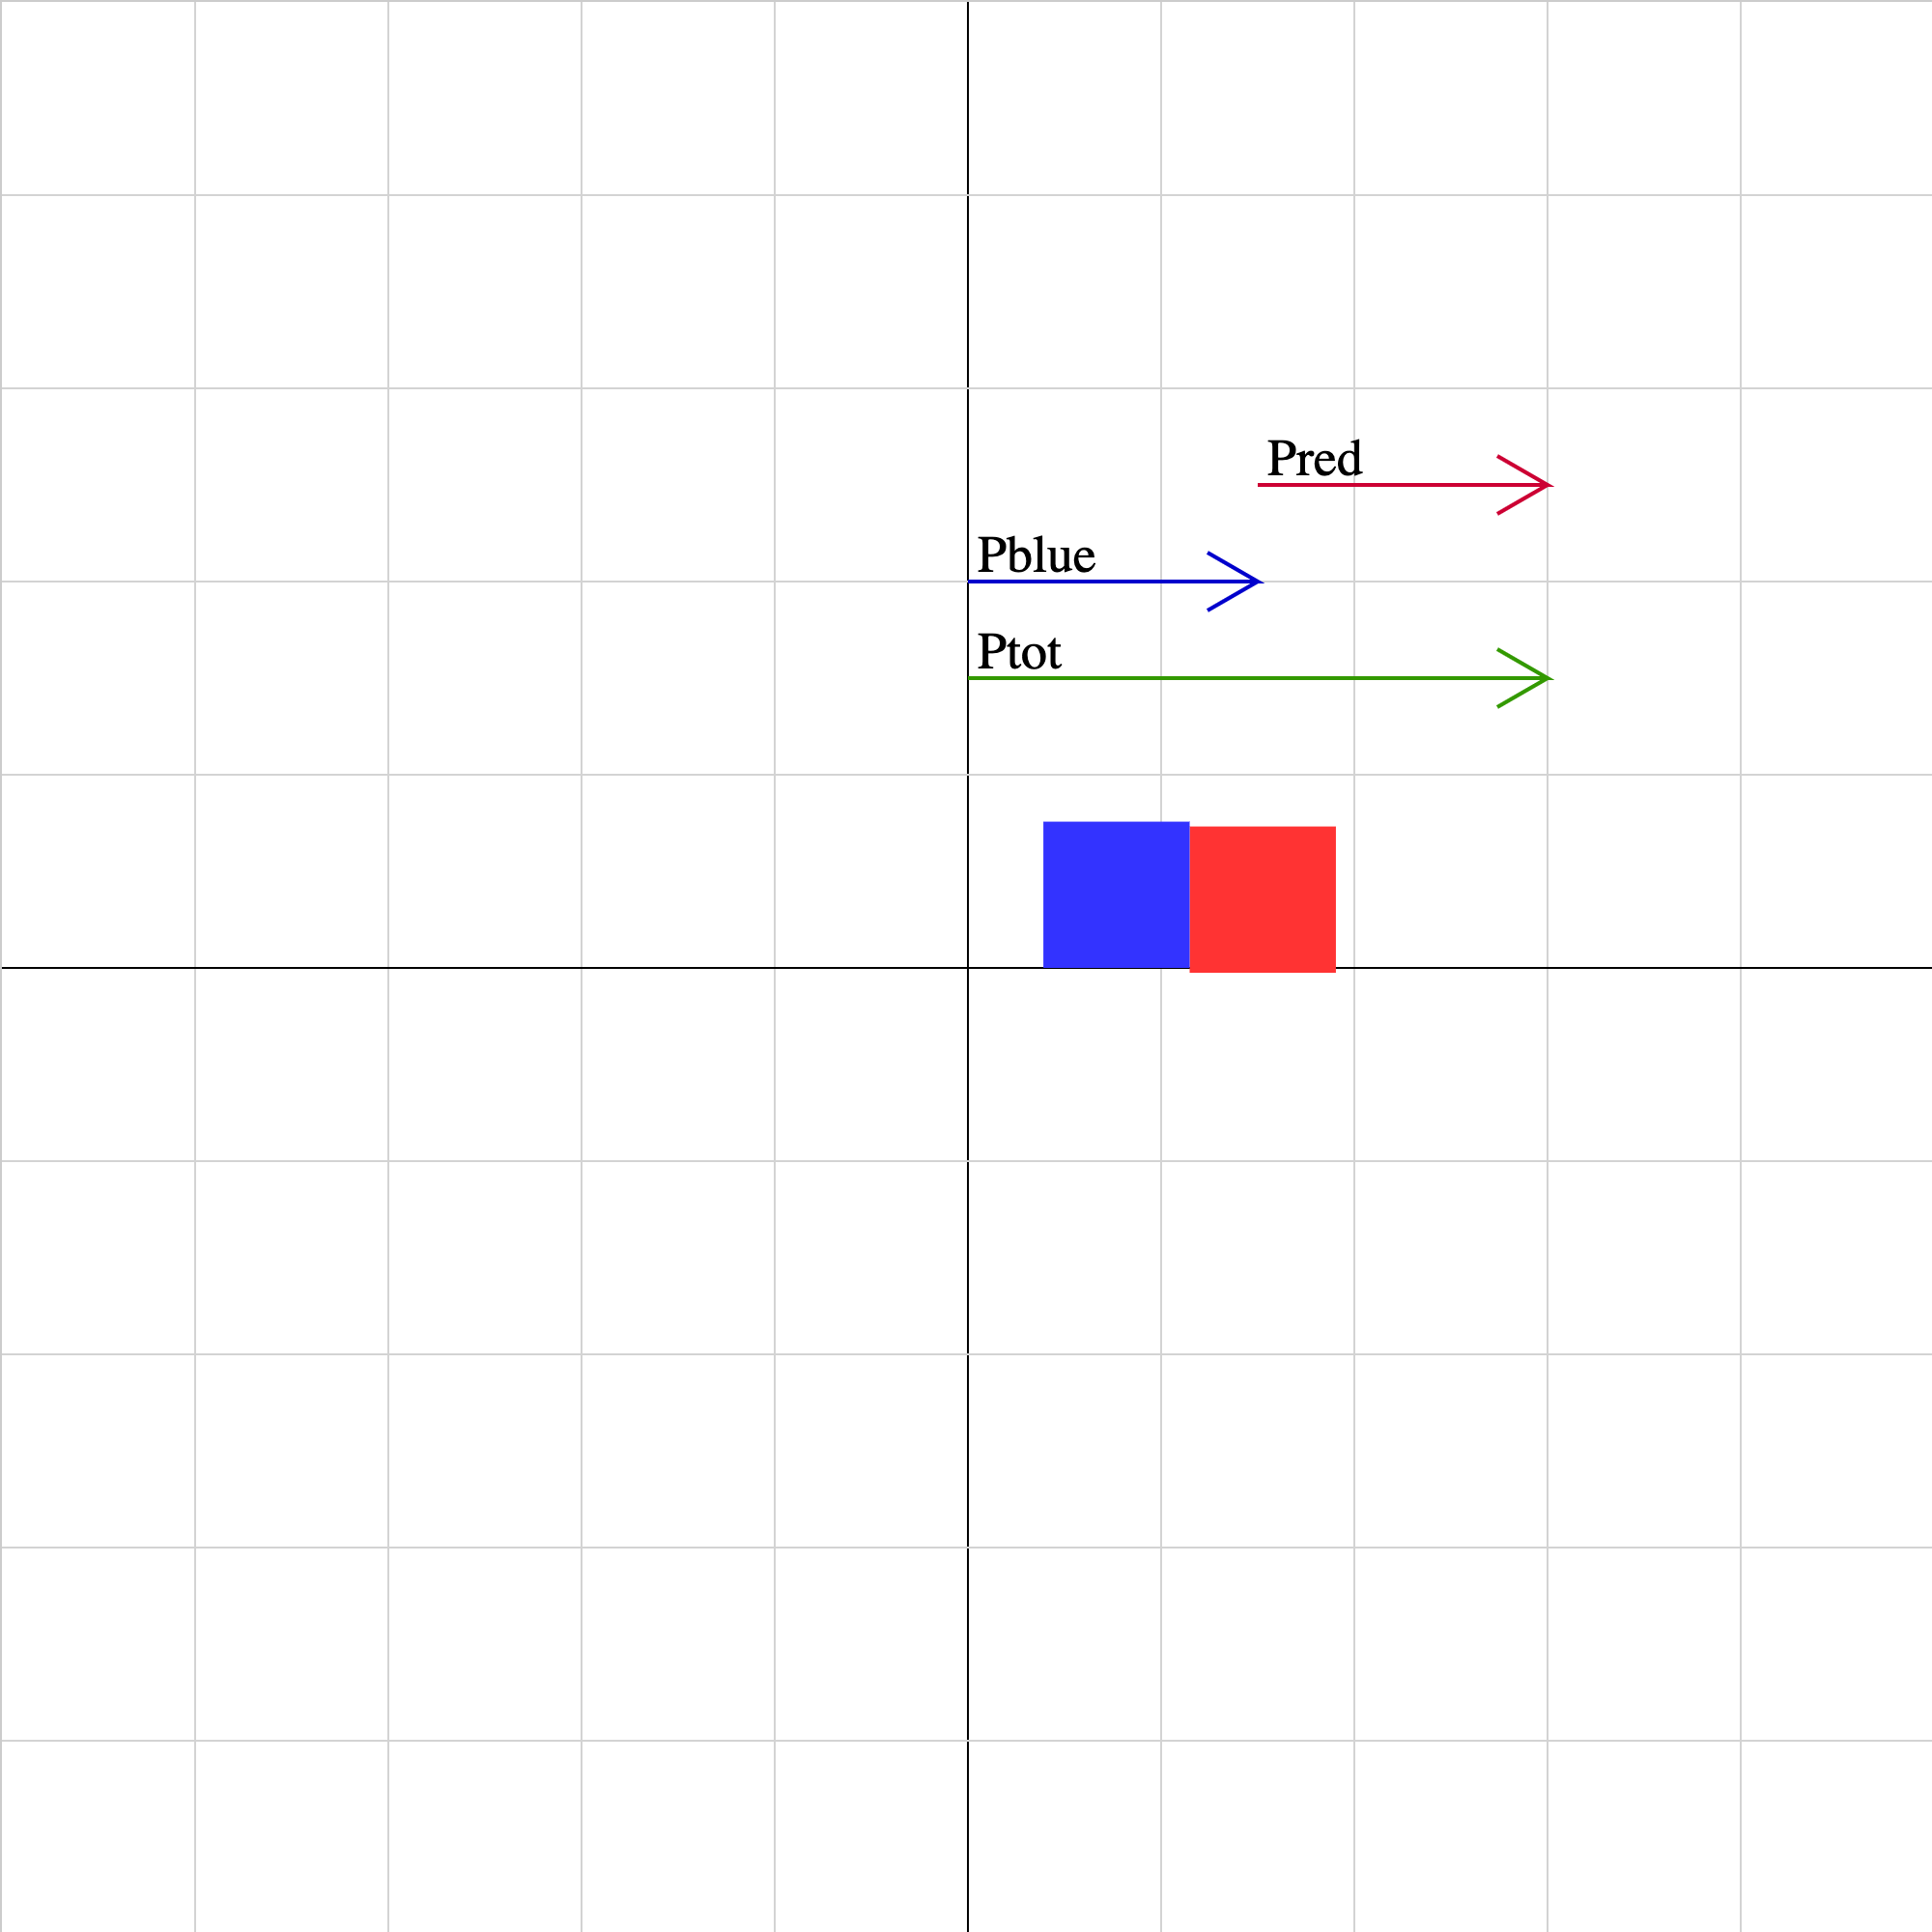
Two objects collide and stick together. The momentum vector of each object as well as the sum of the momentum vectors is displayed. The lengths of the vectors are drawn to the same scale. Unphysical results may be obtained for combinations of initial velocities for which the objects cannot collide.
collision-03.iwp
Two objects collide and stick together. The momentum vector of each object as well as the sum of the momentum vectors is displayed. The lengths of the vectors are drawn to the same scale. Unphysical results may be obtained for combinations of initial velocities for which the objects cannot collide.
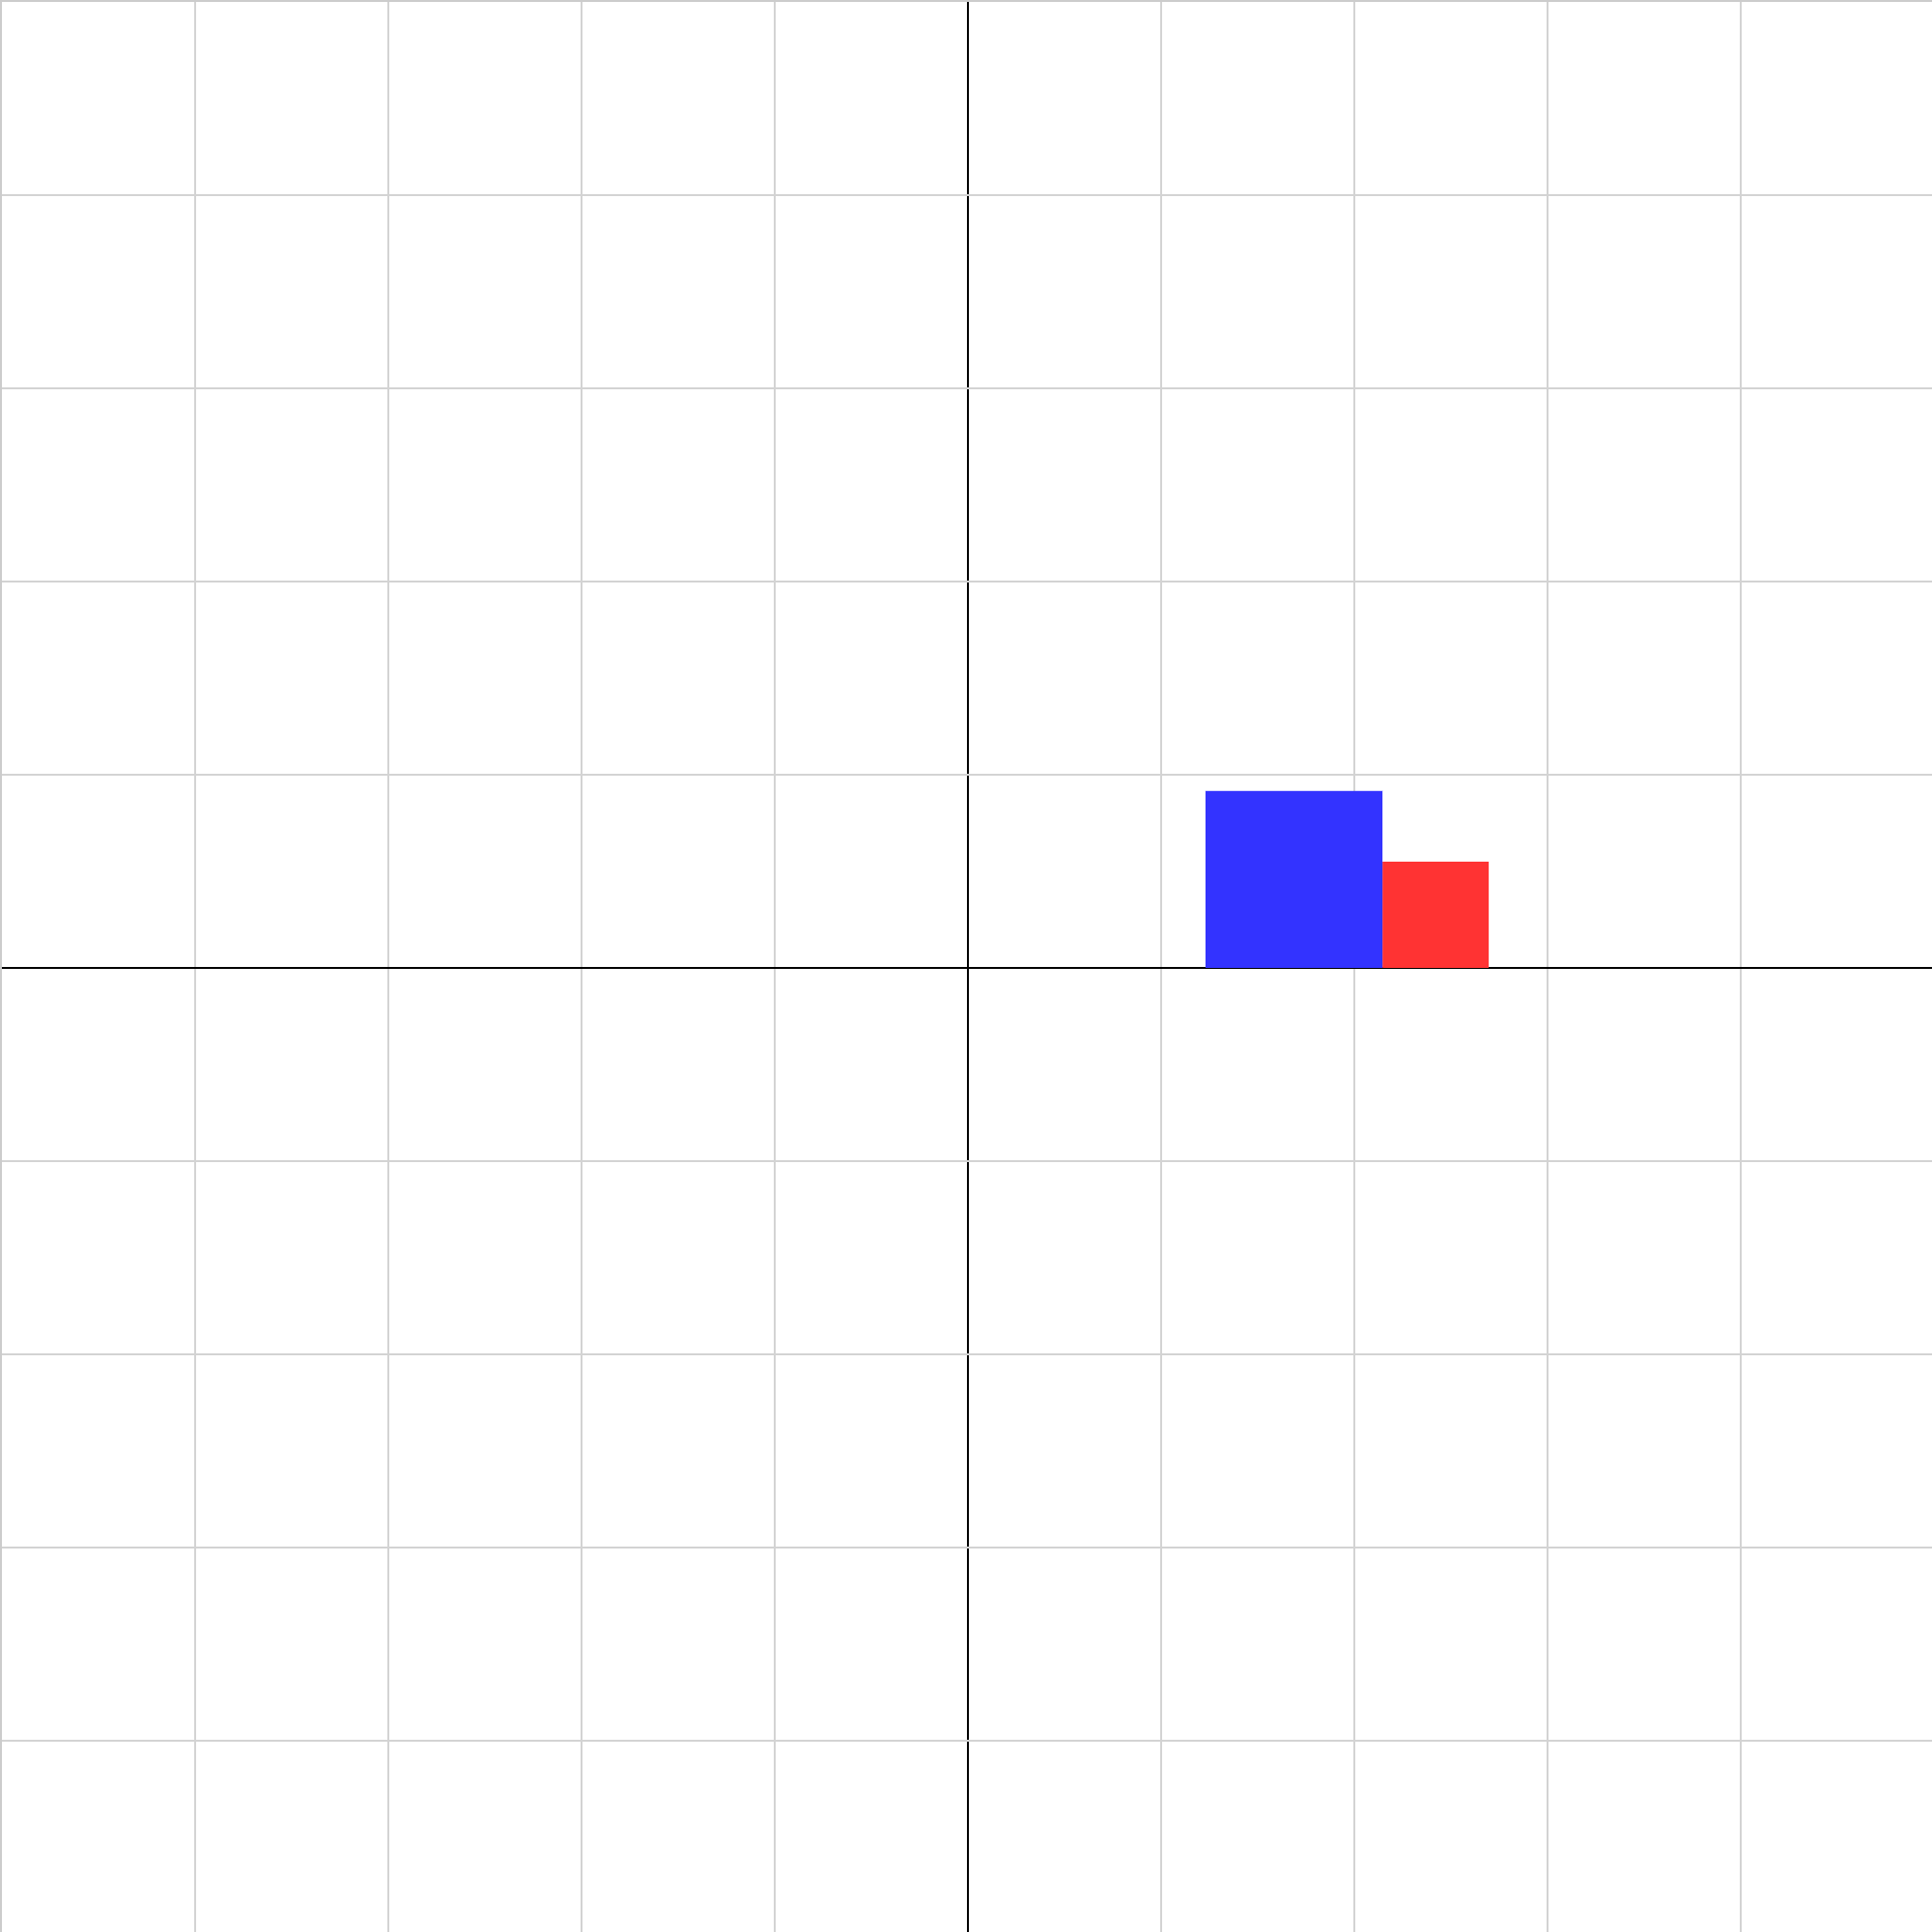
collision-04.iwp
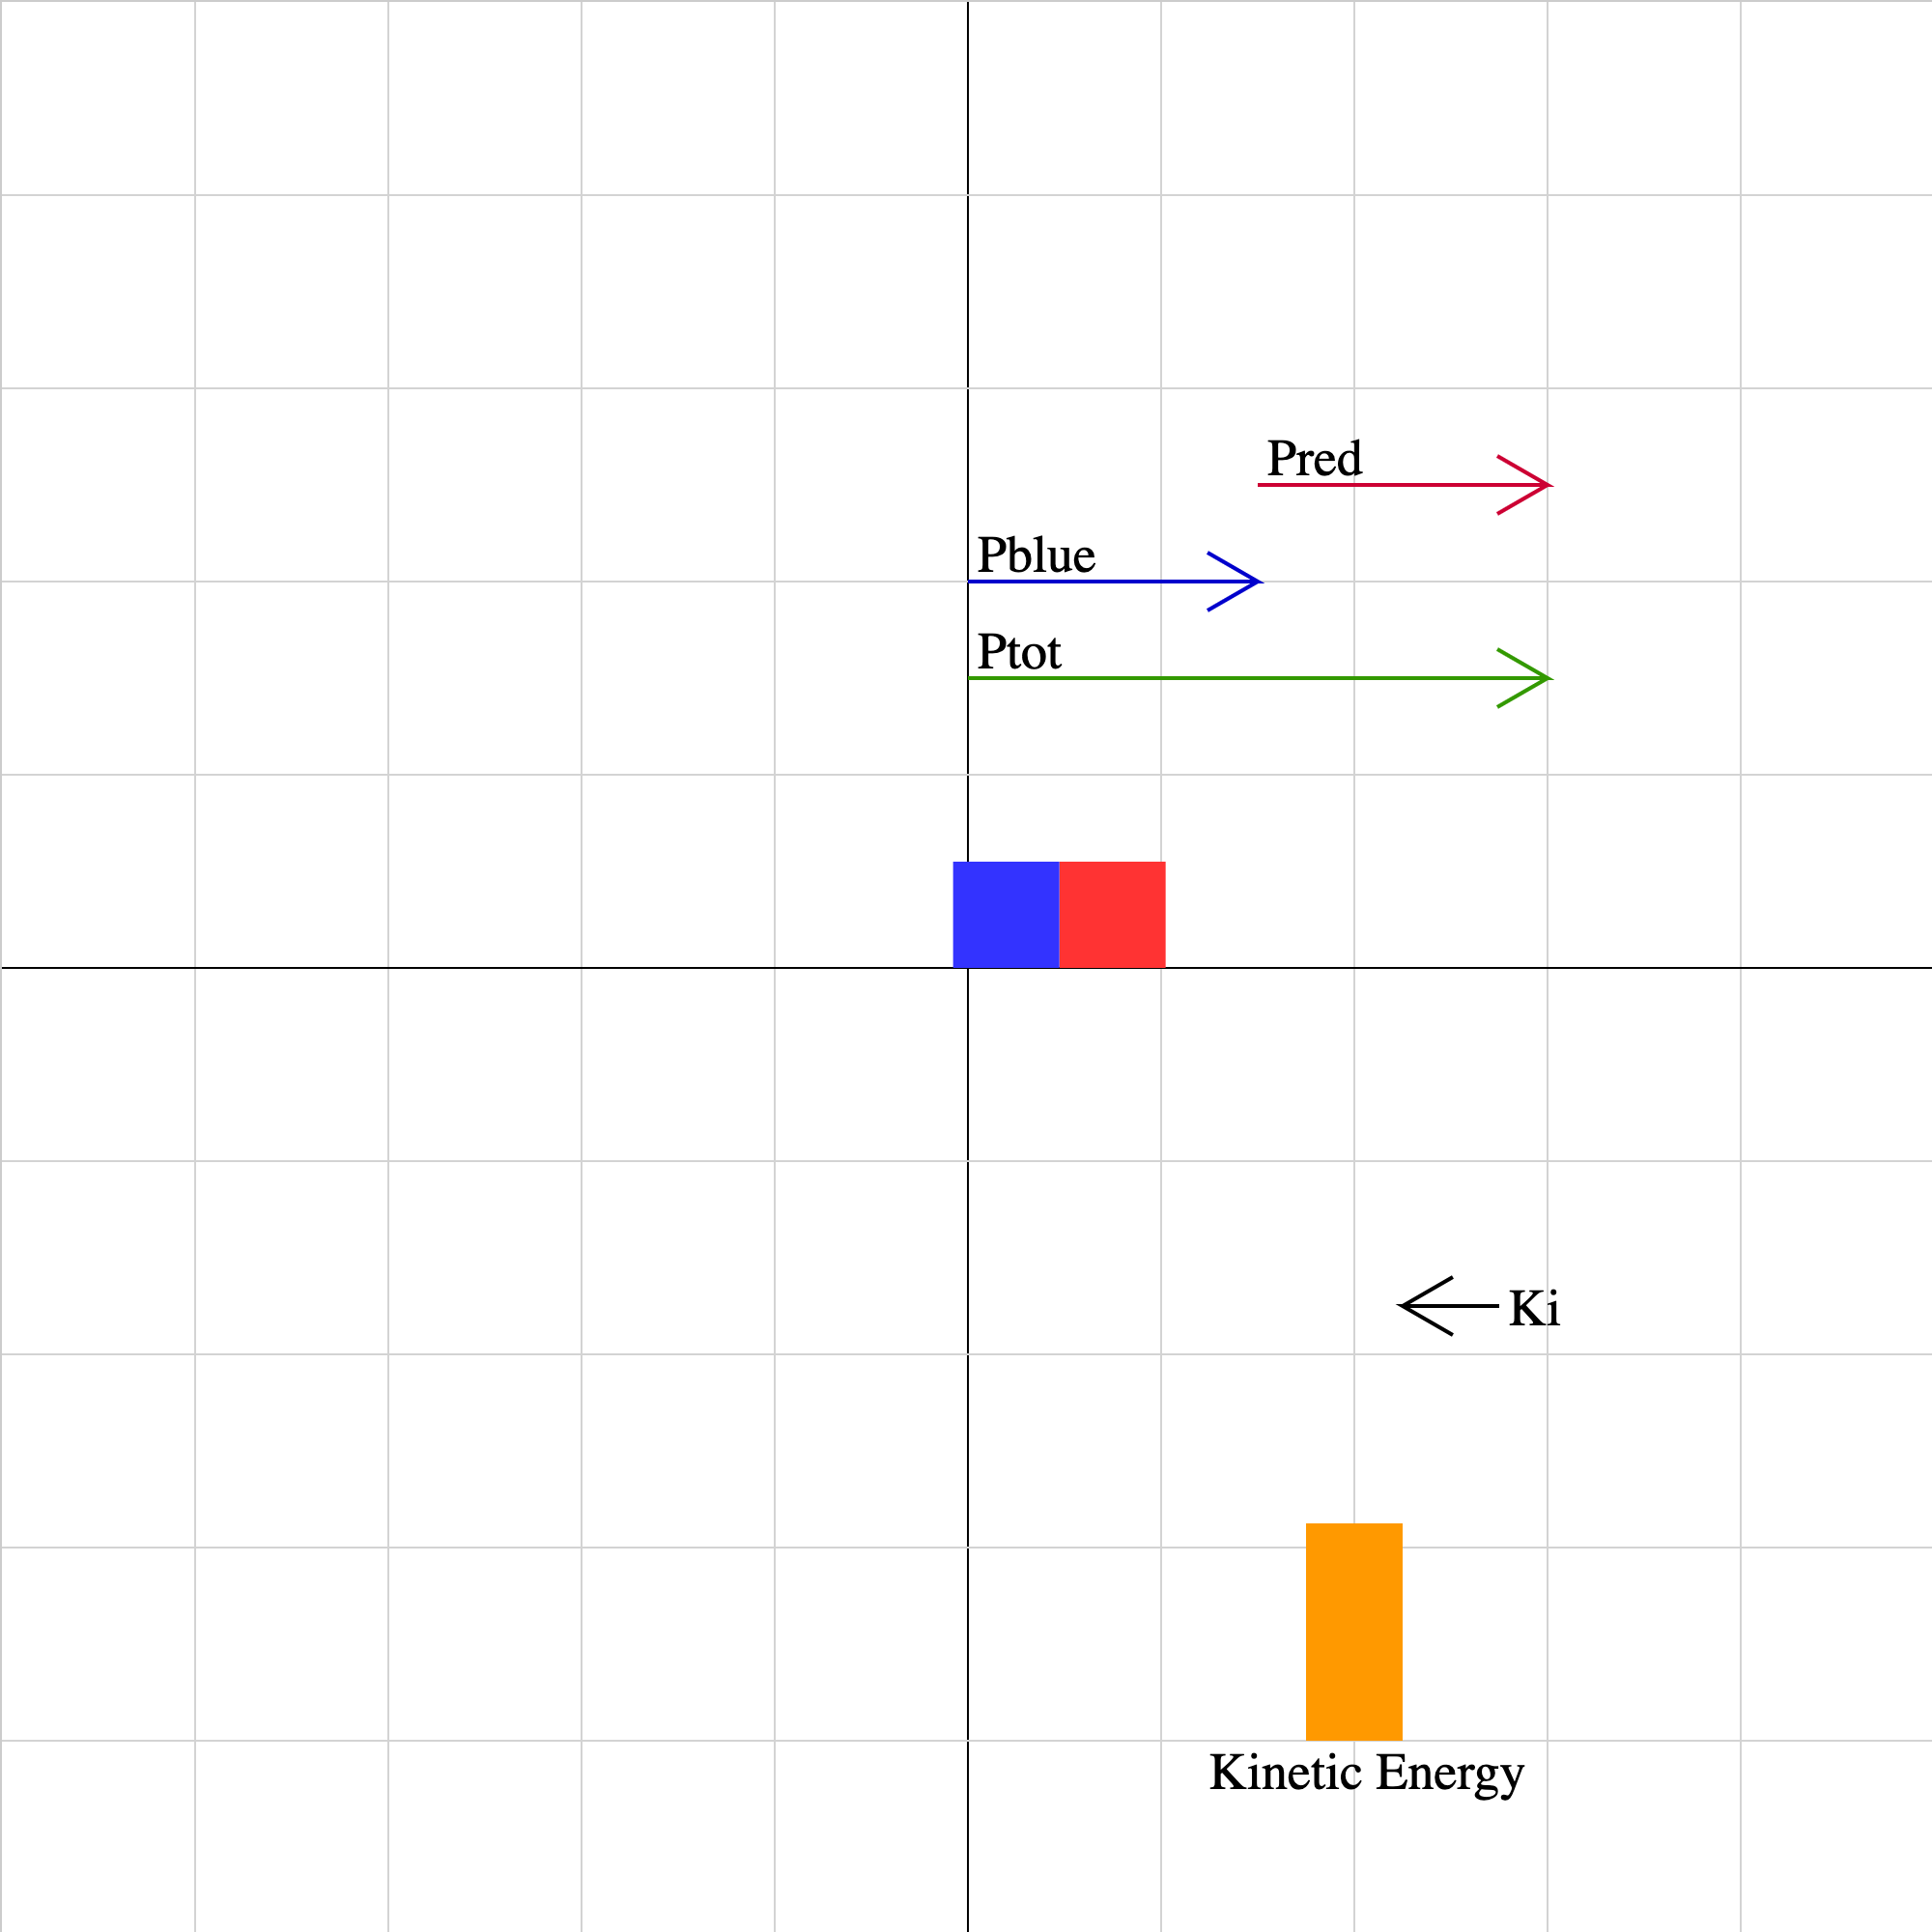
Two objects collide. The momentum vector of each object as well as the sum of the momentum vectors is displayed. The lengths of the vectors are drawn relative to the magnitude of the momentum. The total kinetic energy of the system of two objects is represented by the orange bar. The coefficient of restitution may have values from 0 to 1. This parameter adjusts the degree of elasticity of the collision. Unphysical results may be obtained for combinations of initial velocities for which the objects cannot collide.
collision-elastic-2a.iwp
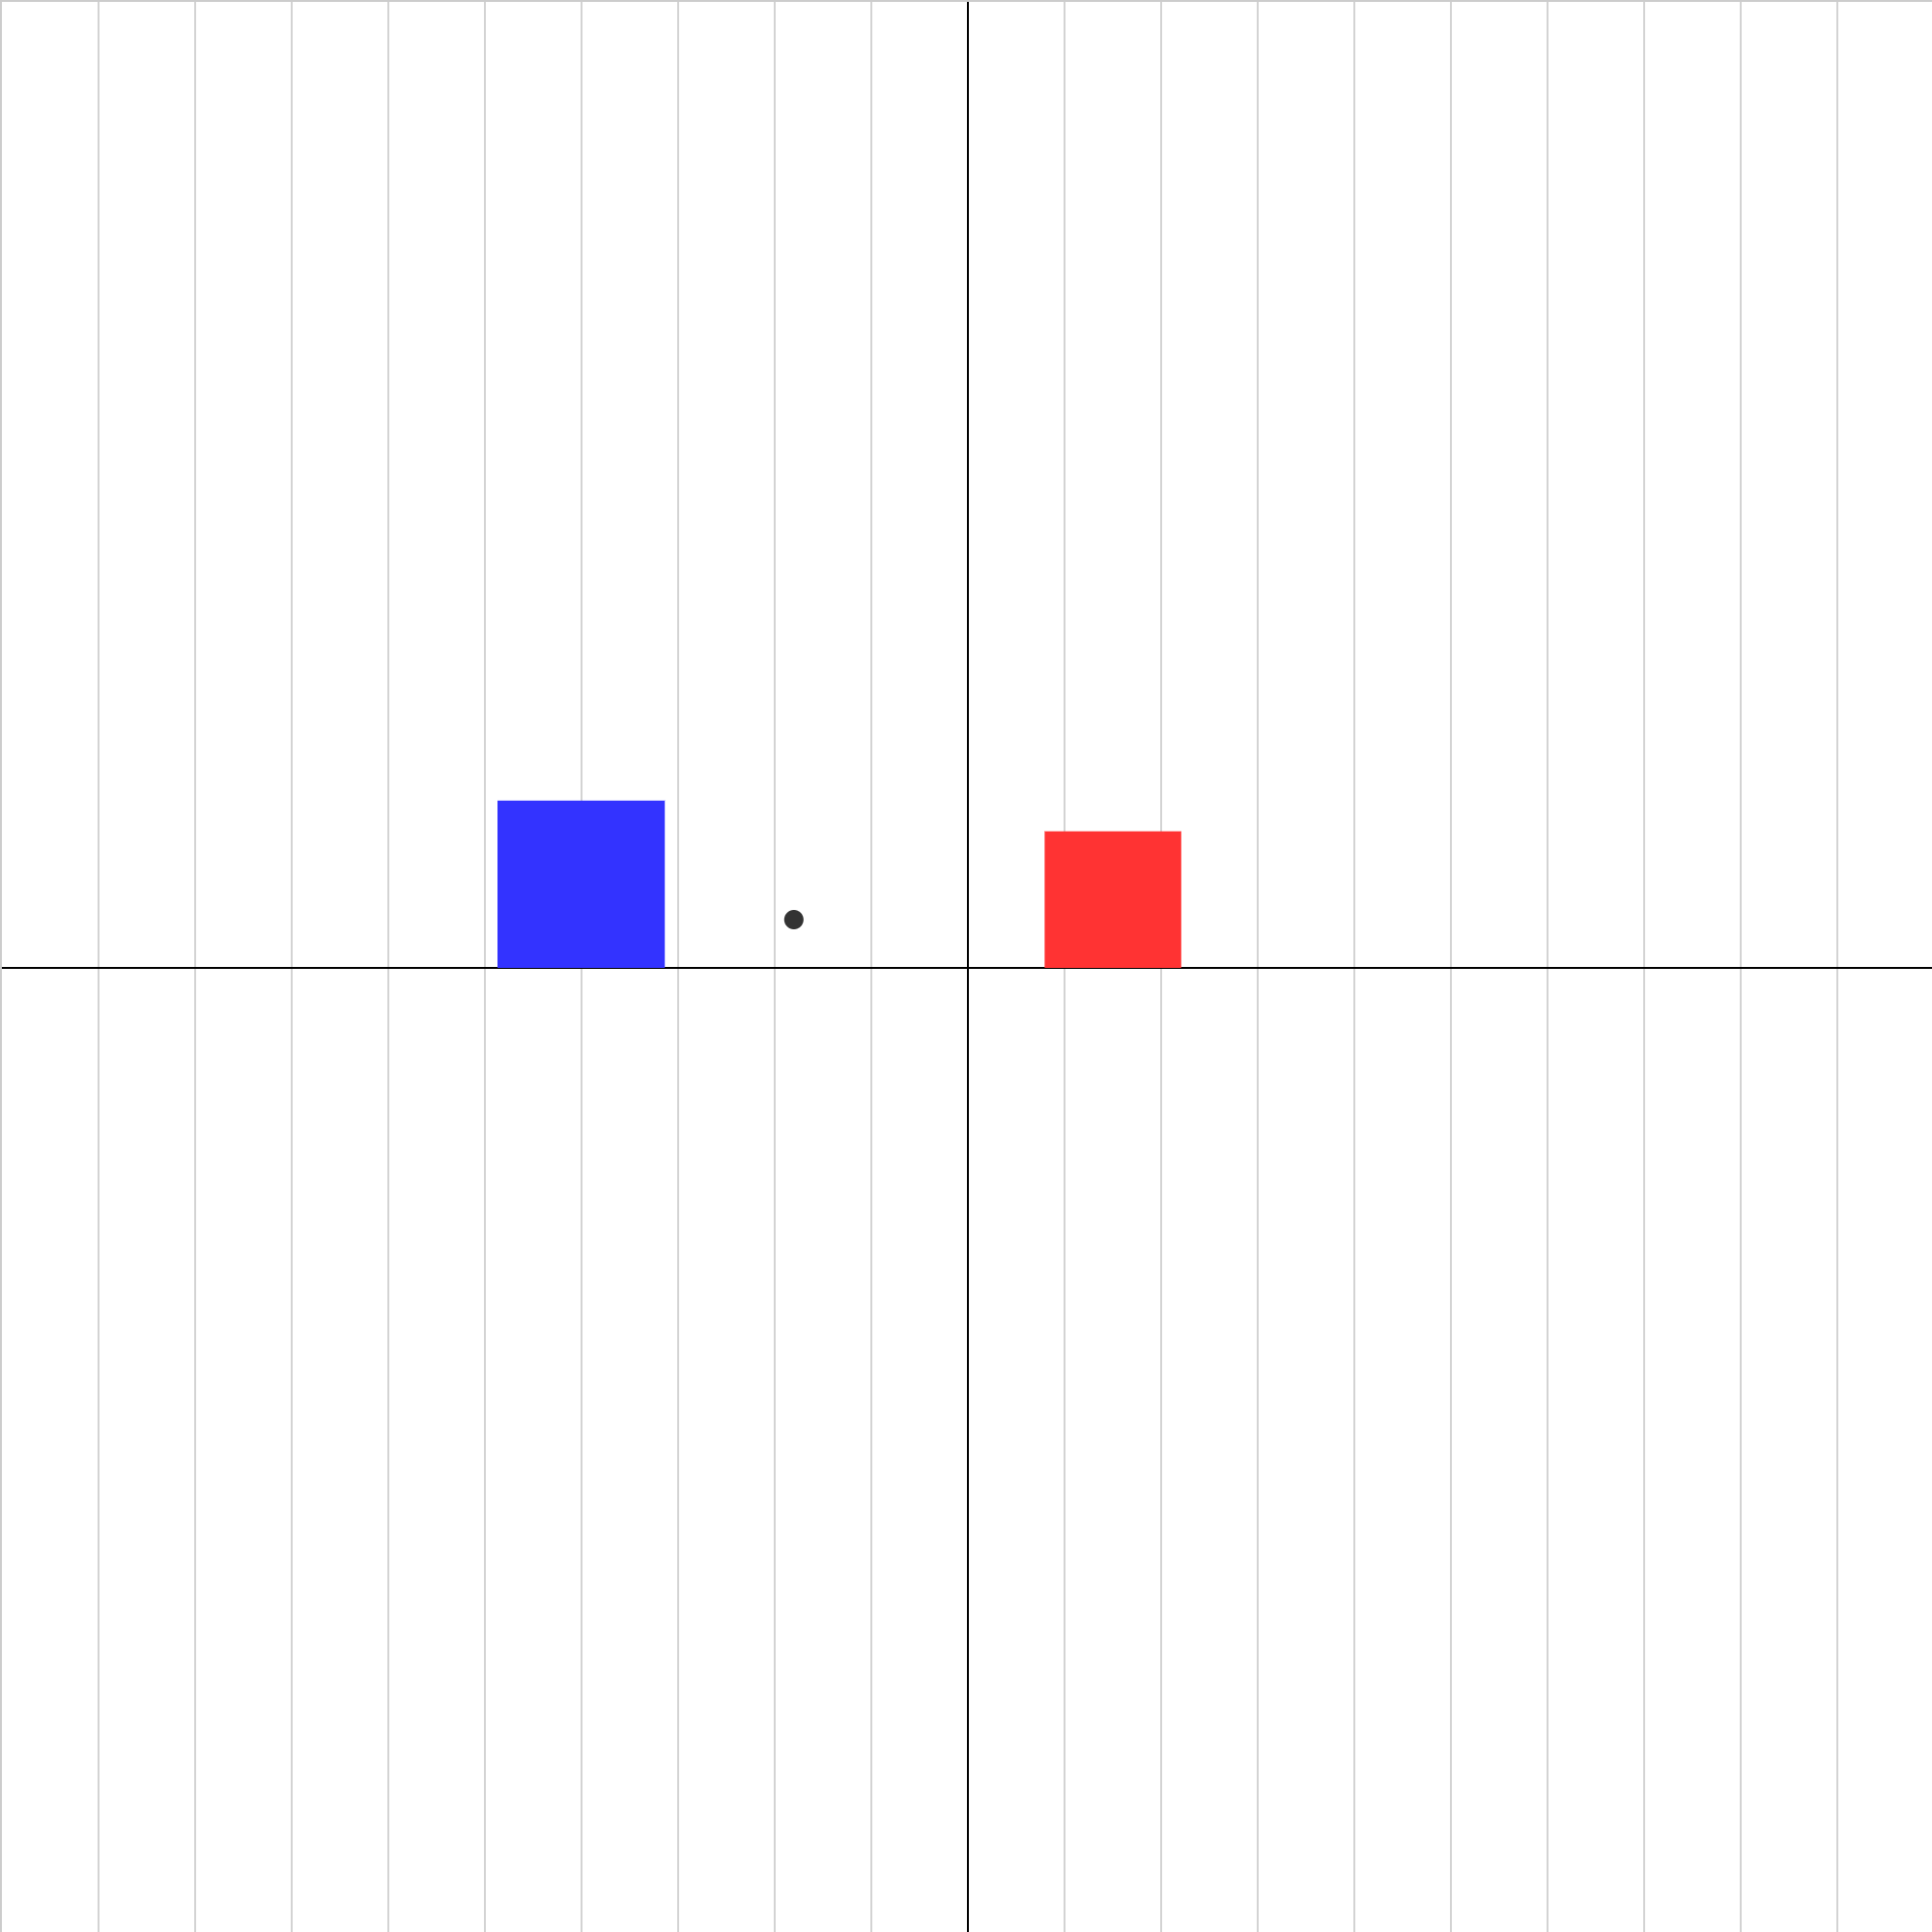
Two gliders collide in an elastic collision. The center of mass of the system of gliders is shown as a black dot. Play the animation. The animation will stop at the beginning of the collision. If the animation were allowed to proceed, predict what the final velocities would be.
collision-elastic-2b.iwp
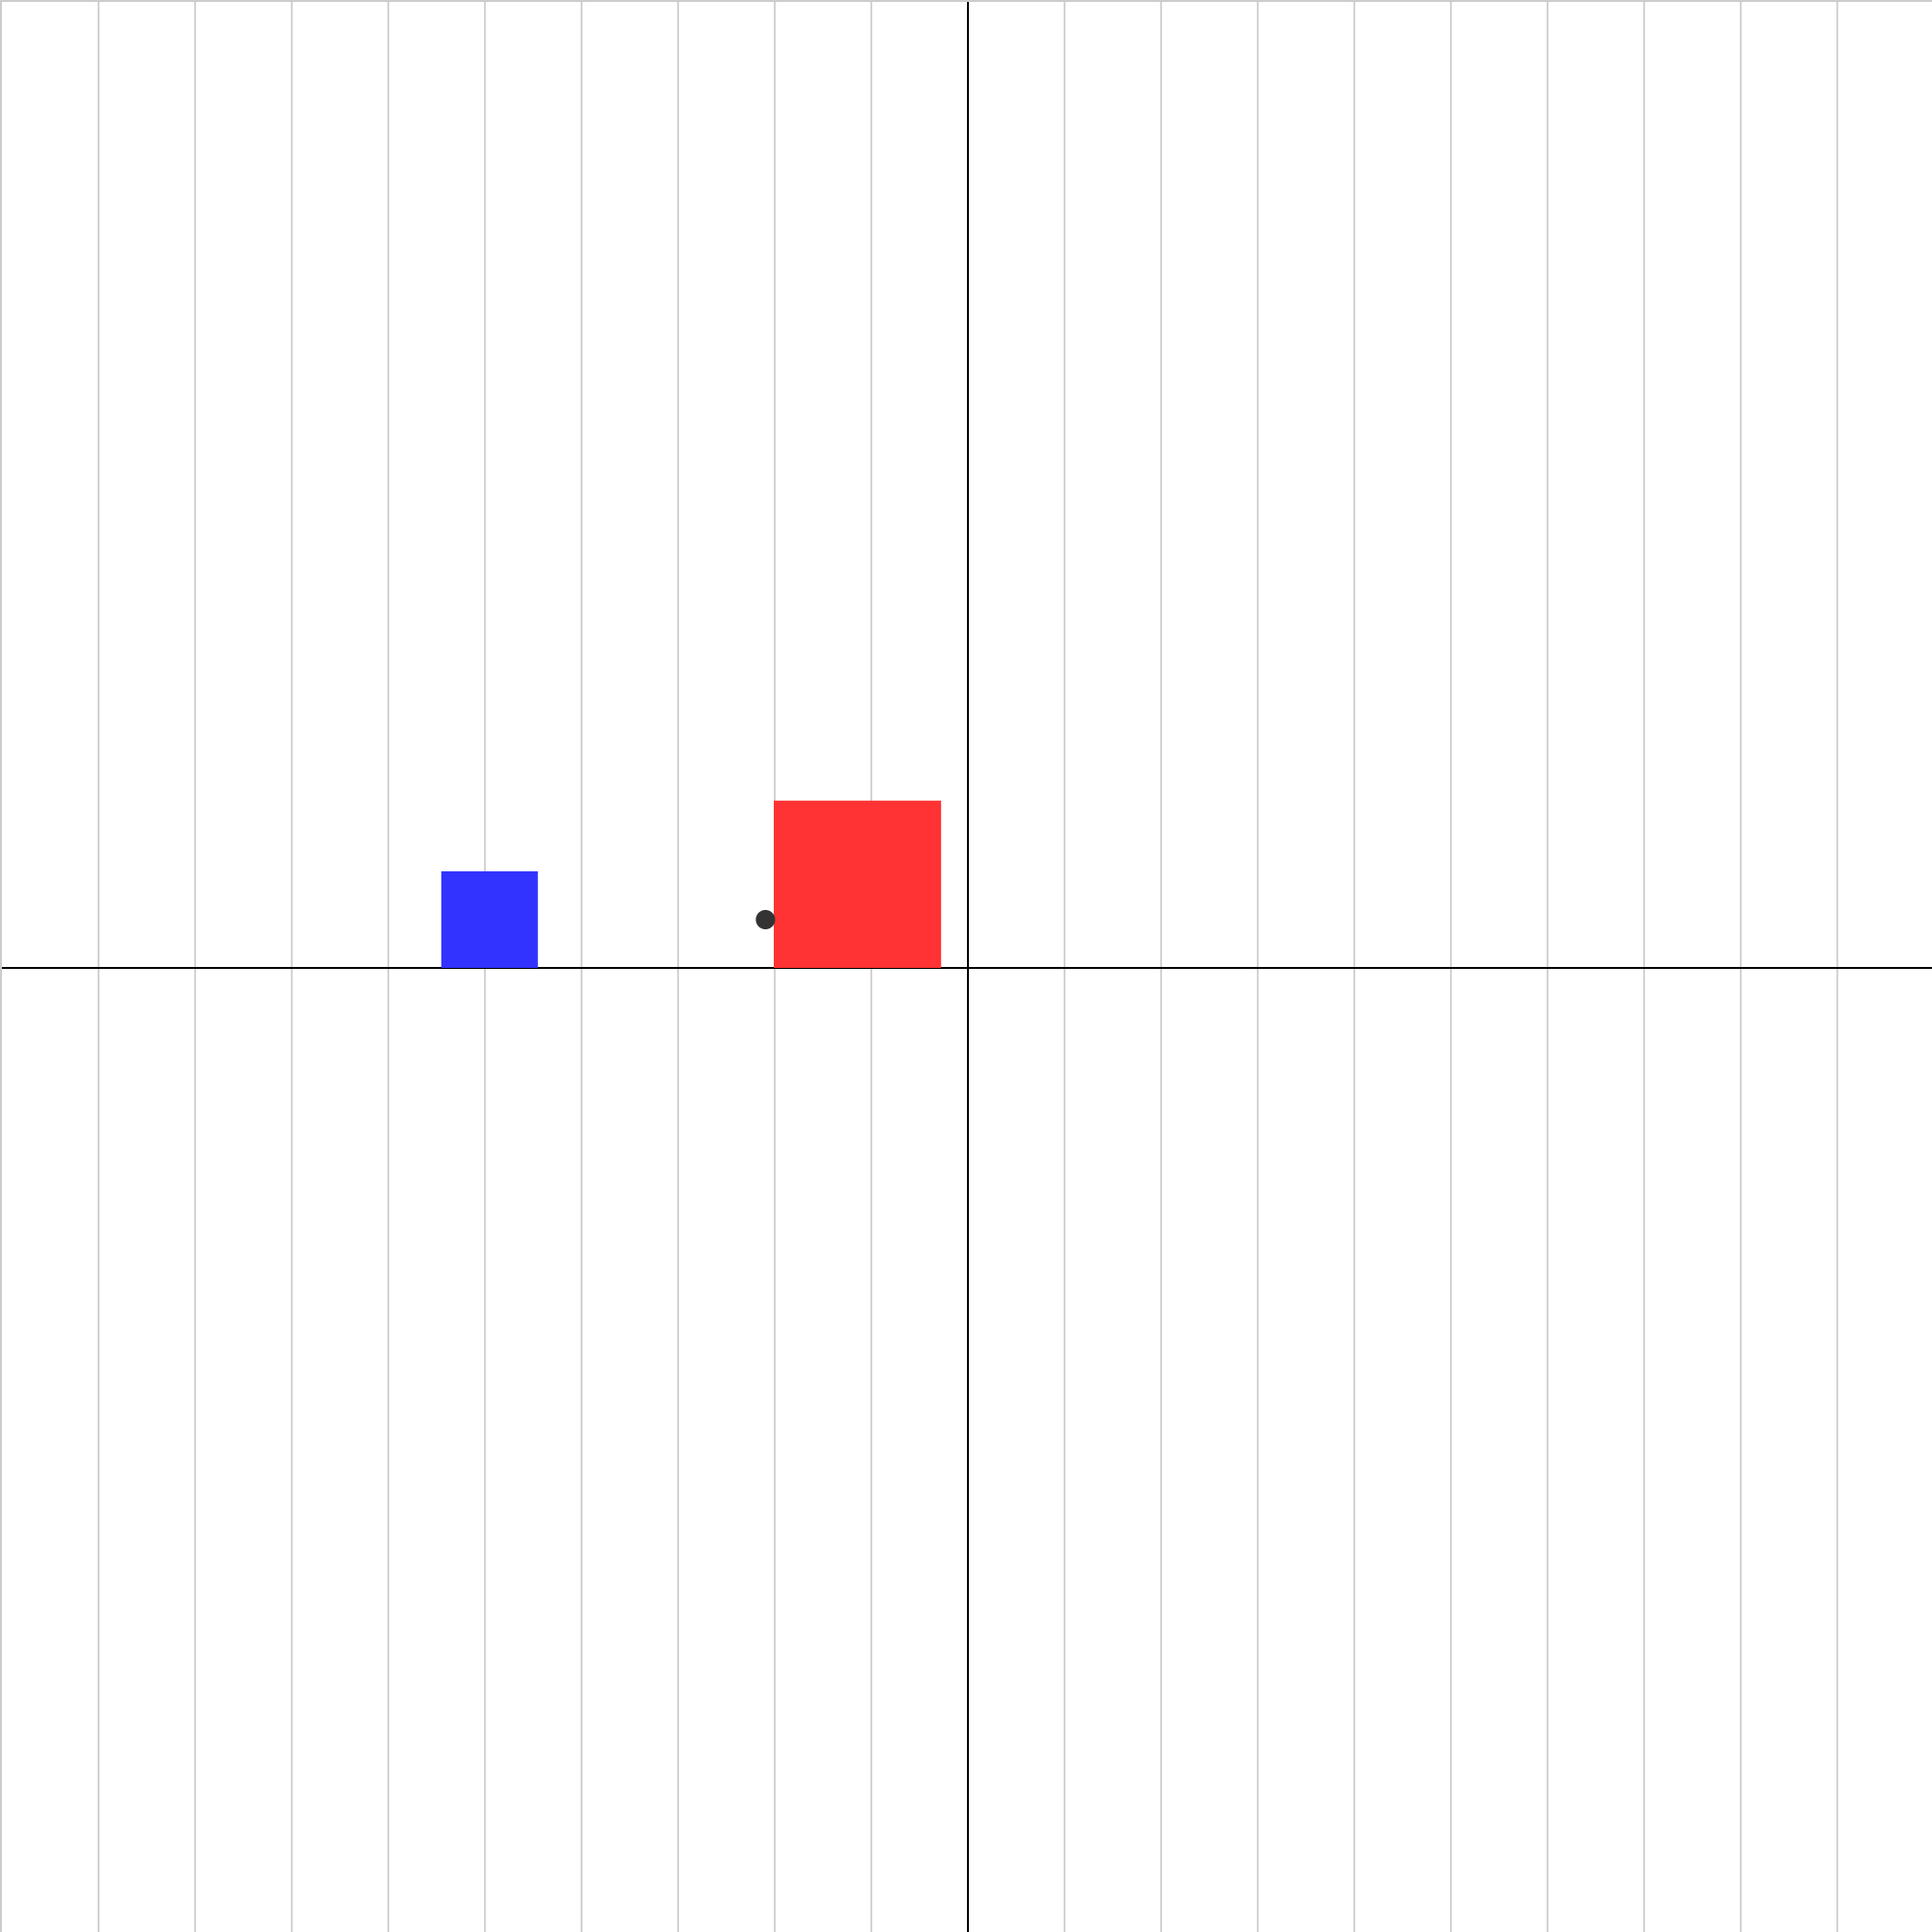
Two gliders collide in an elastic collision. The center of mass of the system of gliders is shown as a black dot. Play the animation. The animation will stop at the beginning of the collision. If the animation were allowed to proceed, predict what the final velocities would be.
collision-elastic-2c.iwp
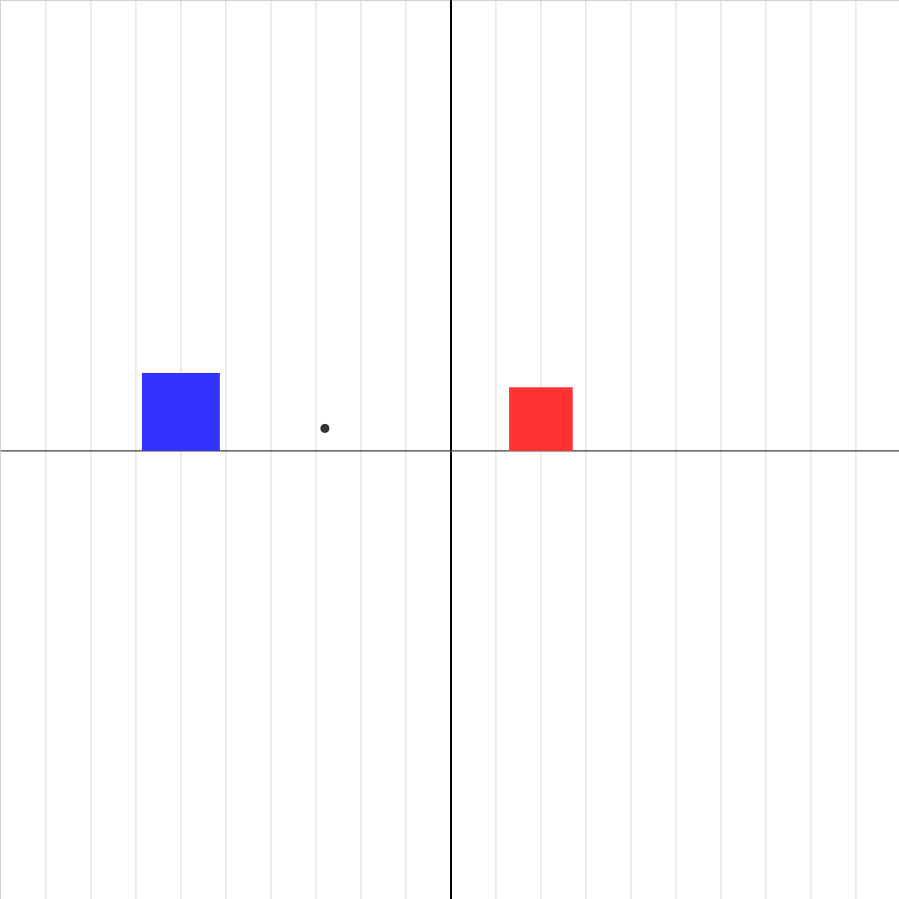
Two gliders collide in an elastic collision. The center of mass of the system of gliders is shown as a black dot. Play the animation. The animation will stop at the beginning of the collision. If the animation were allowed to proceed, predict what the final velocities would be.
collision-elastic-3.iwp
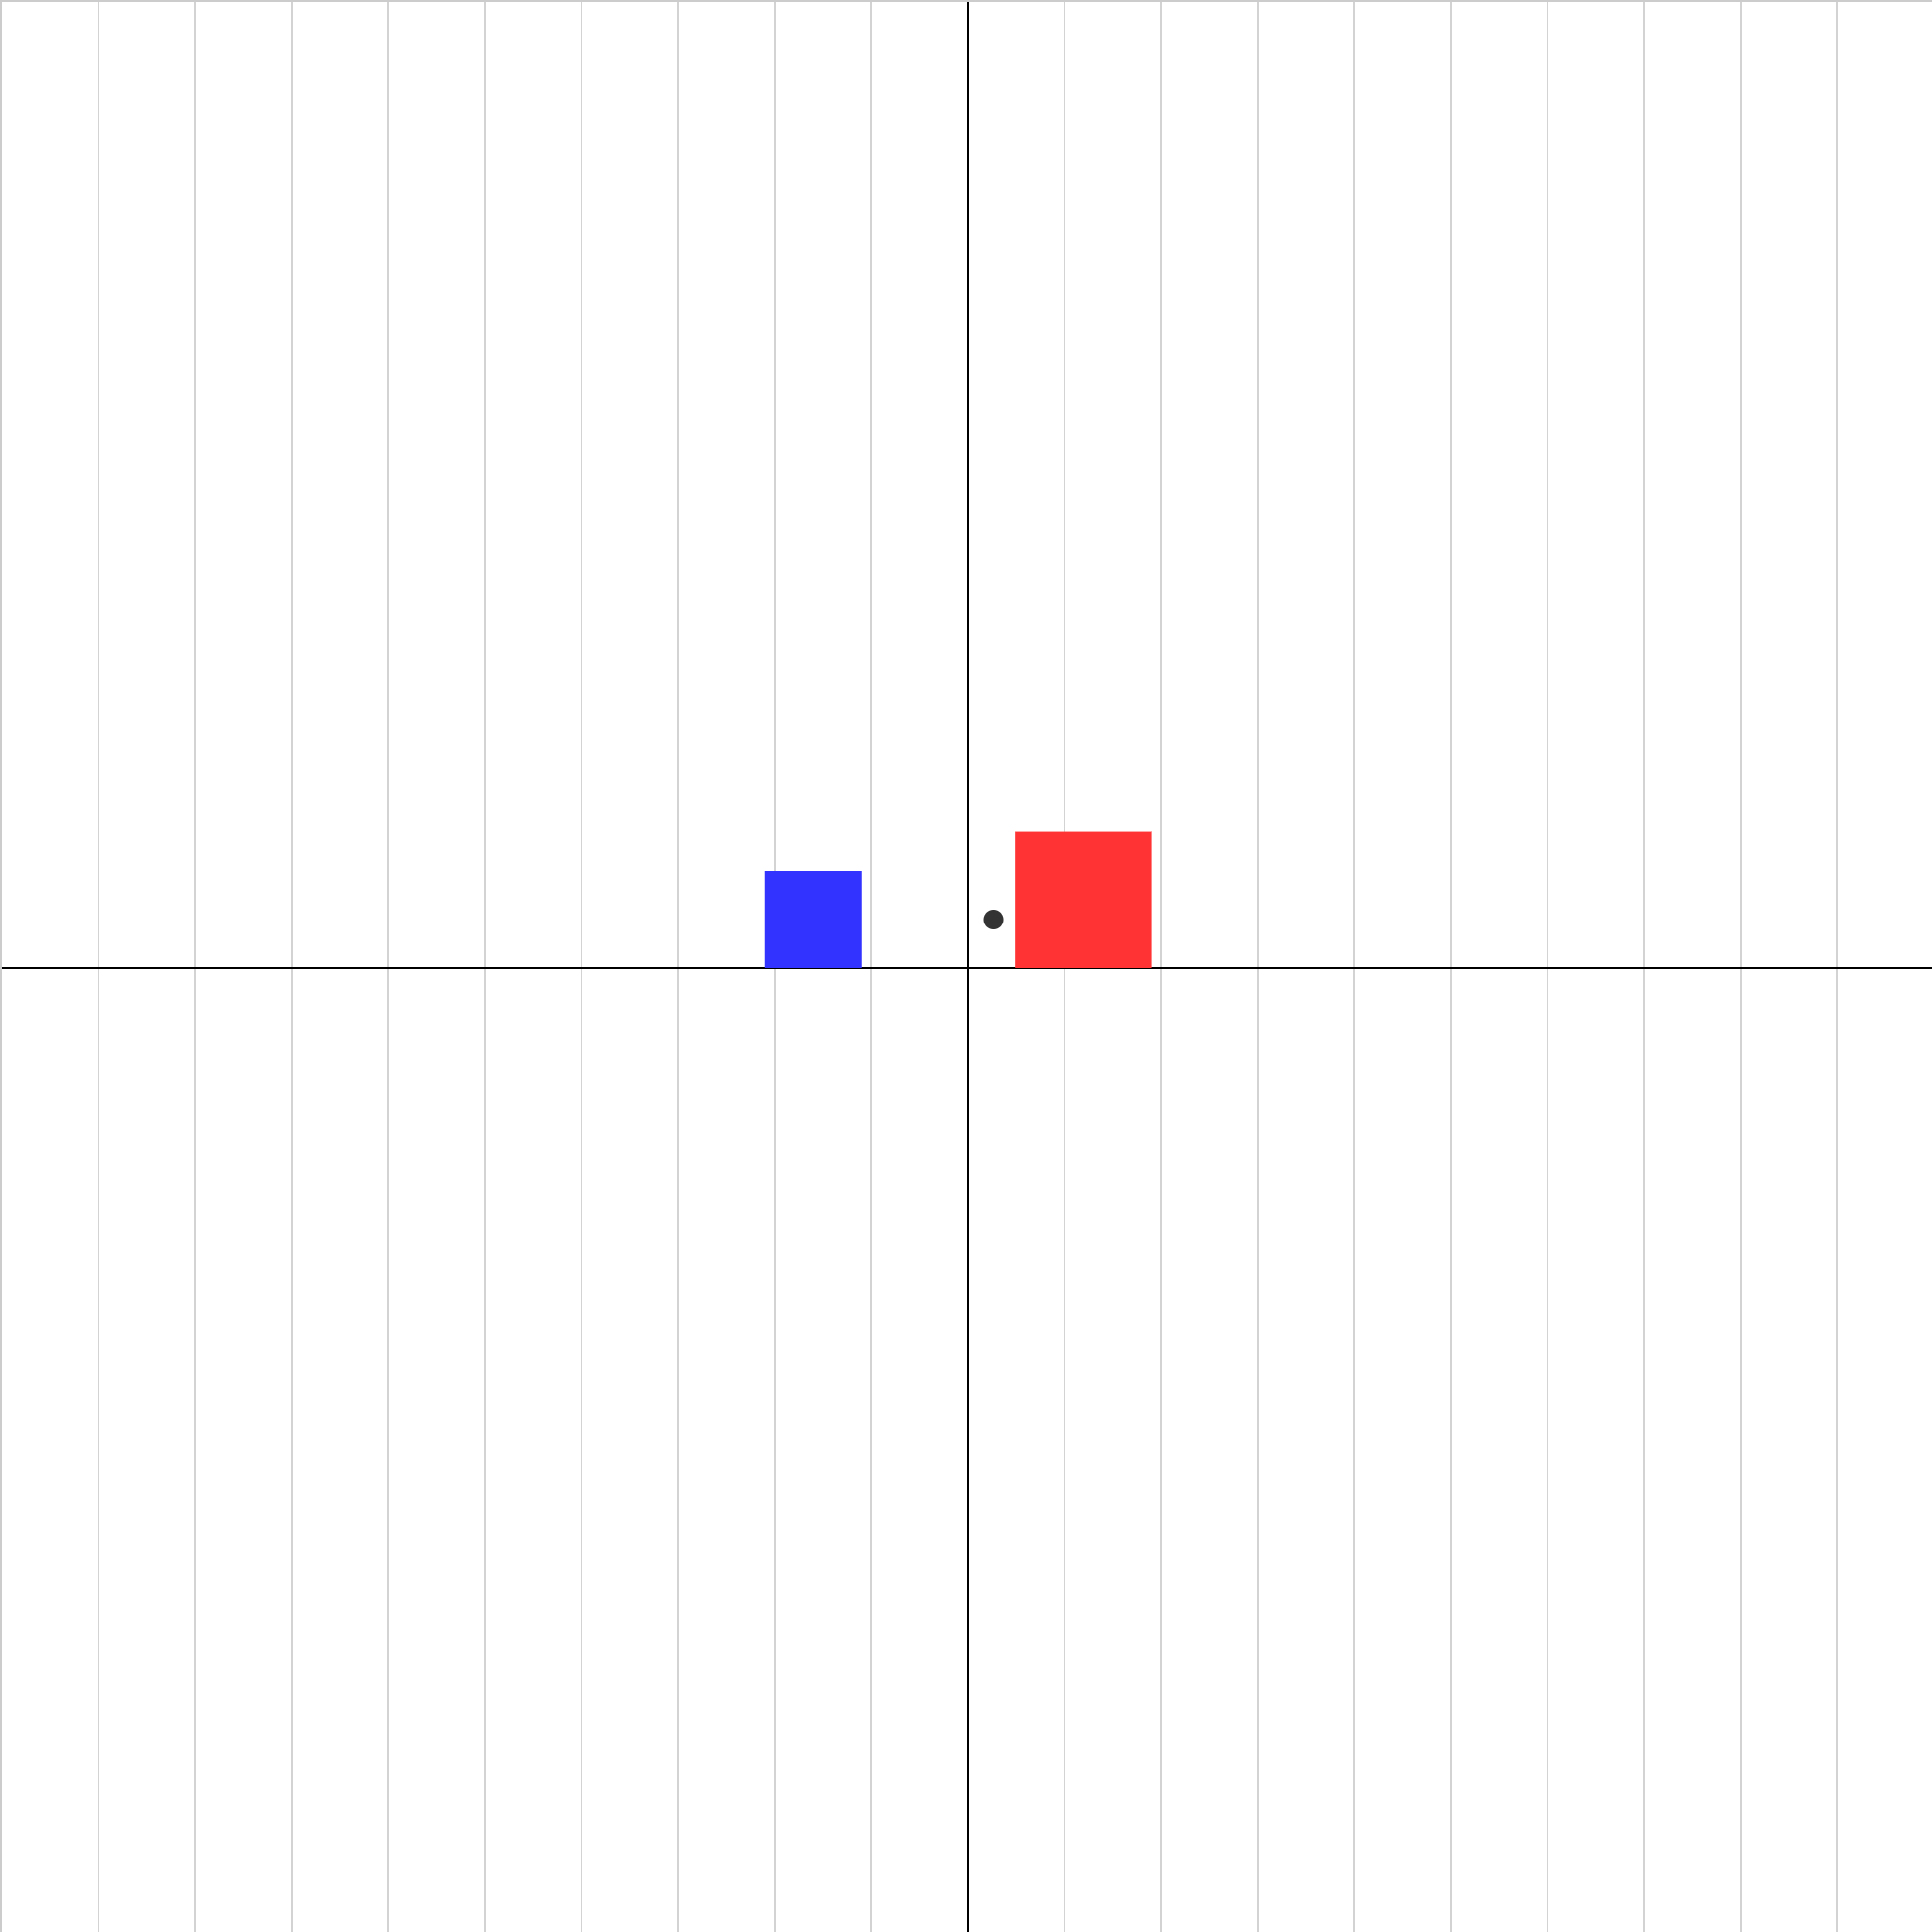
Two gliders collide in an elastic collision. The x-coordinate of the center of mass of the system of gliders is shown as a black dot. Play the animation. Click Show Graph. The velocities of the two objects and of the center of mass will be displayed as a function of time. Try collisions for different values of mass and initial velocity. After a while, you should be able to predict the final velocities, given any pair of initial velocities.
collision-elastic-4a.iwp
Determine the center of mass velocity for this elastic collision. Why is the center of mass velocity the same before and after the collision? Look at the velocity vs. time graphs. If you added a line for the center of mass velocity, what would it look like?
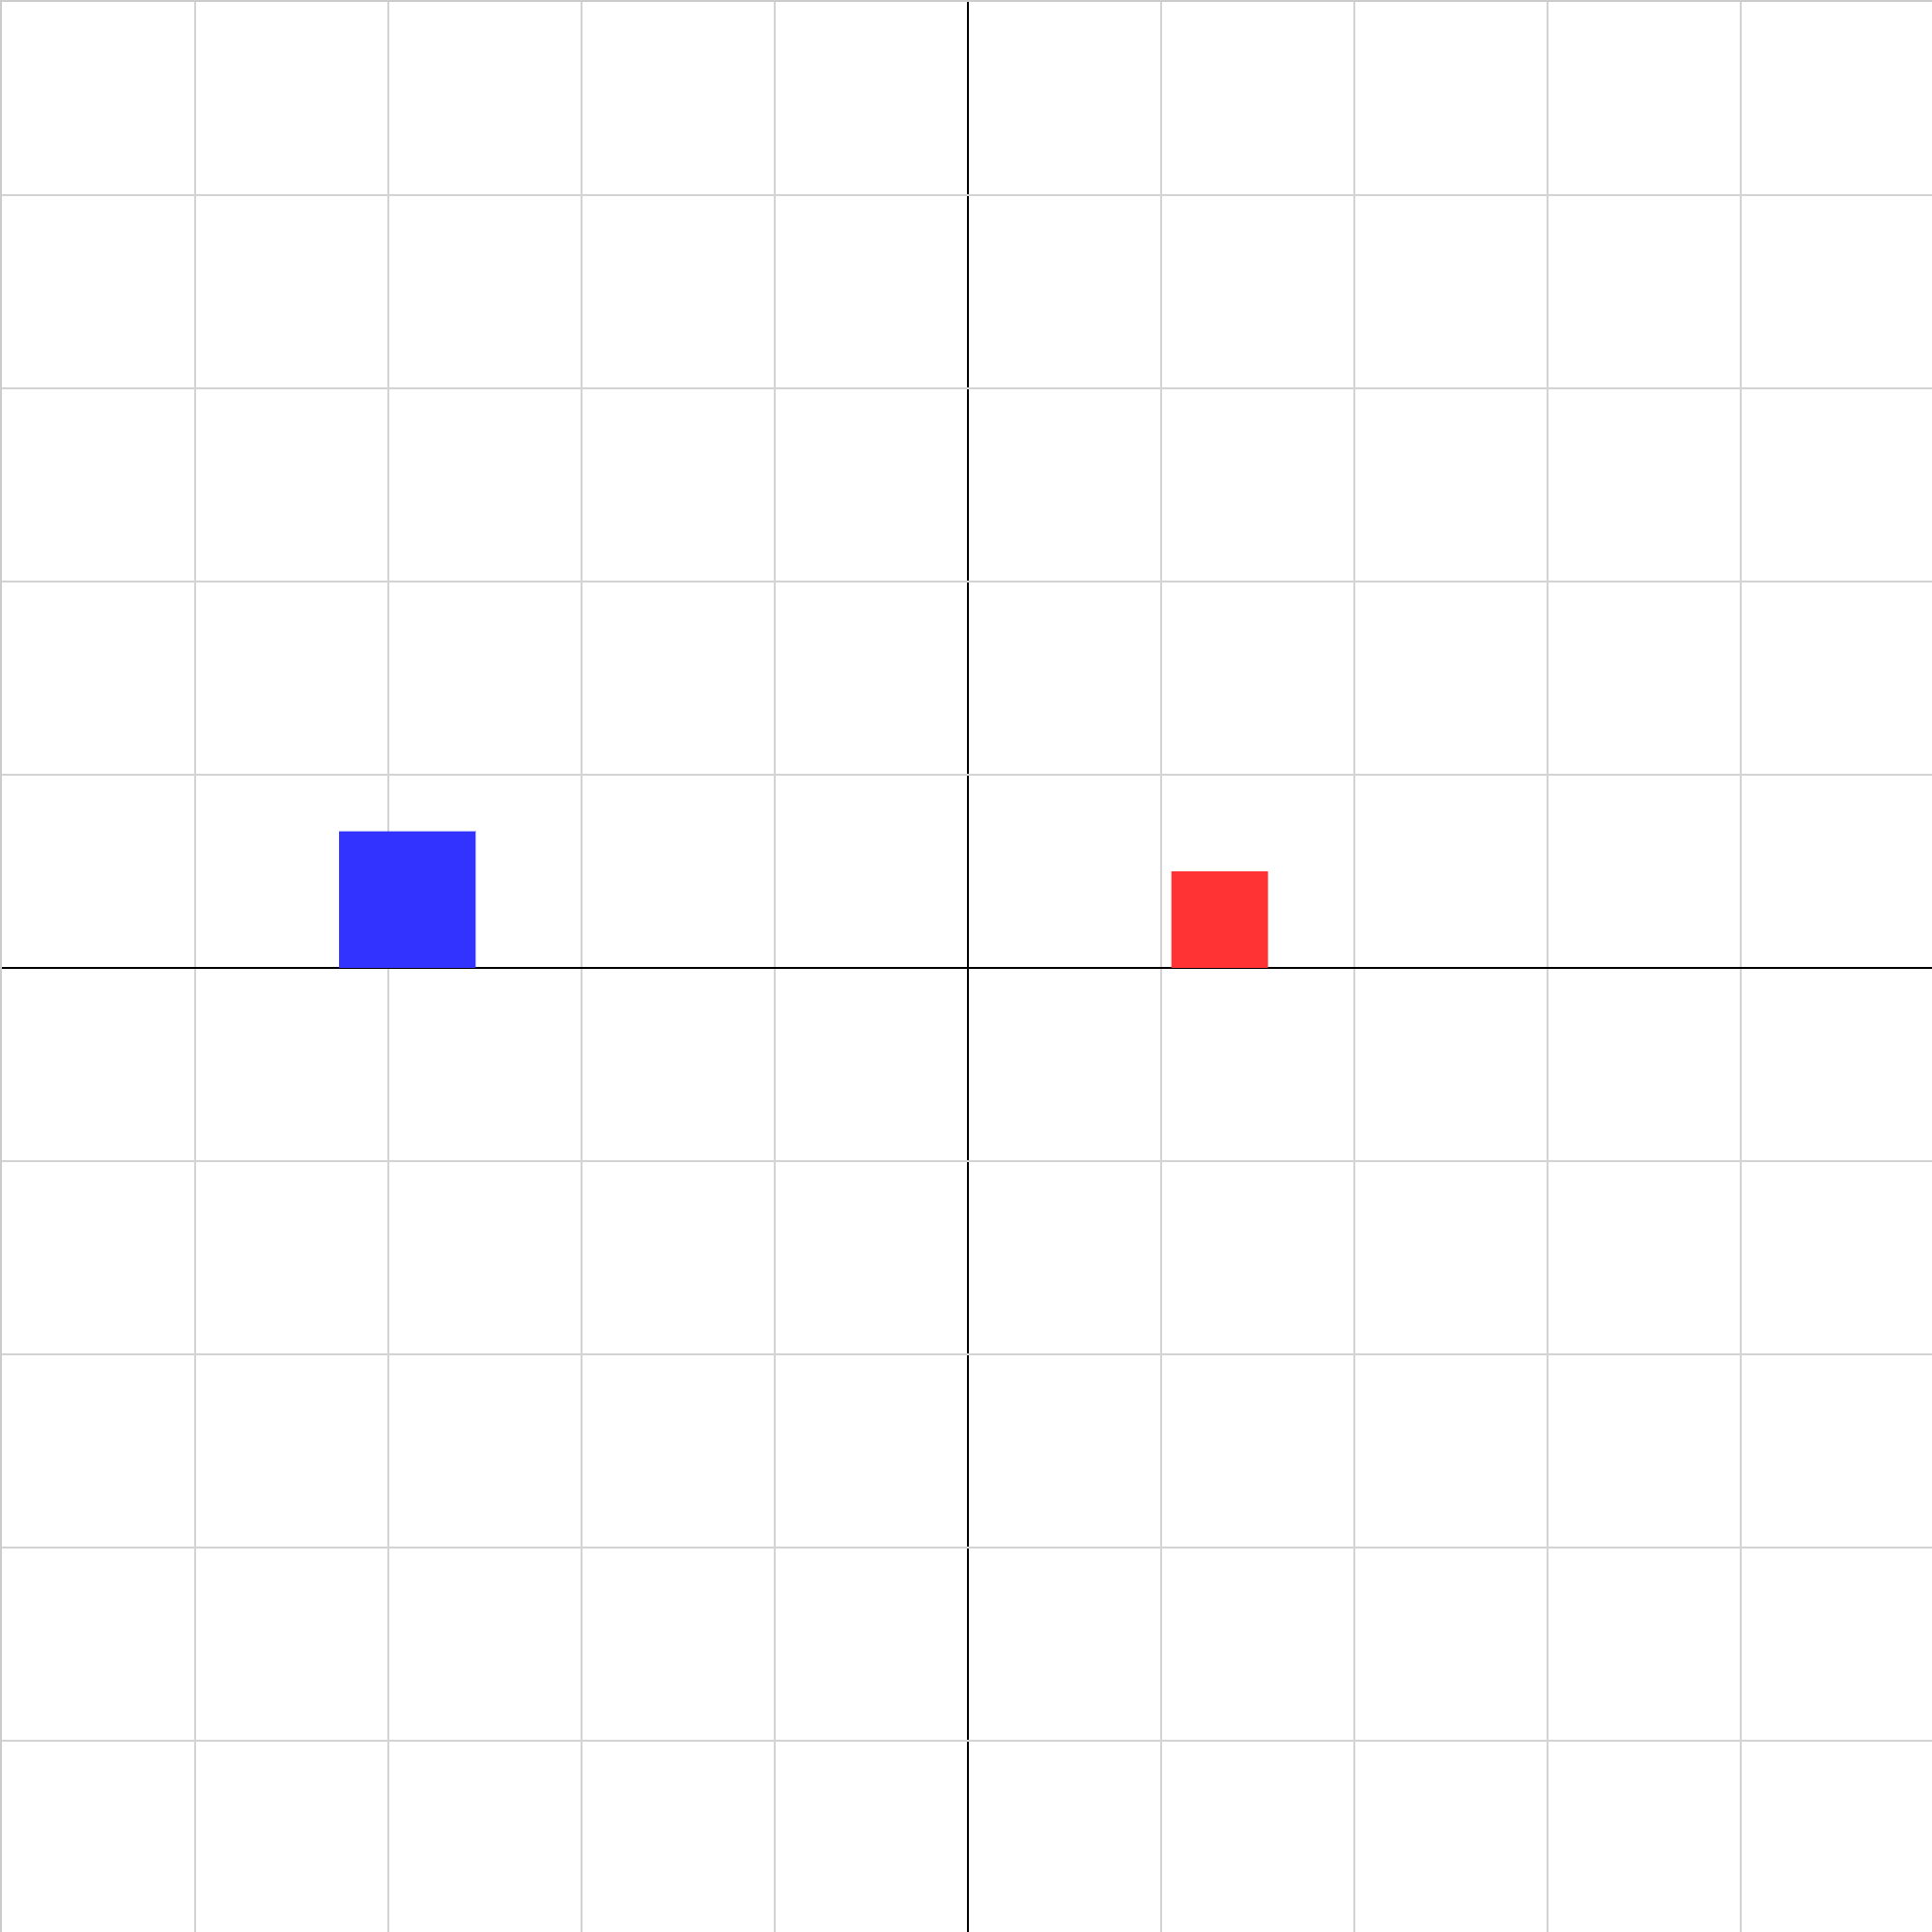
collision-explosion-02.iwp
Two objects are initially at rest. A spring-loaded plunger attached to the red block is quickly released, and the blocks push each other apart.
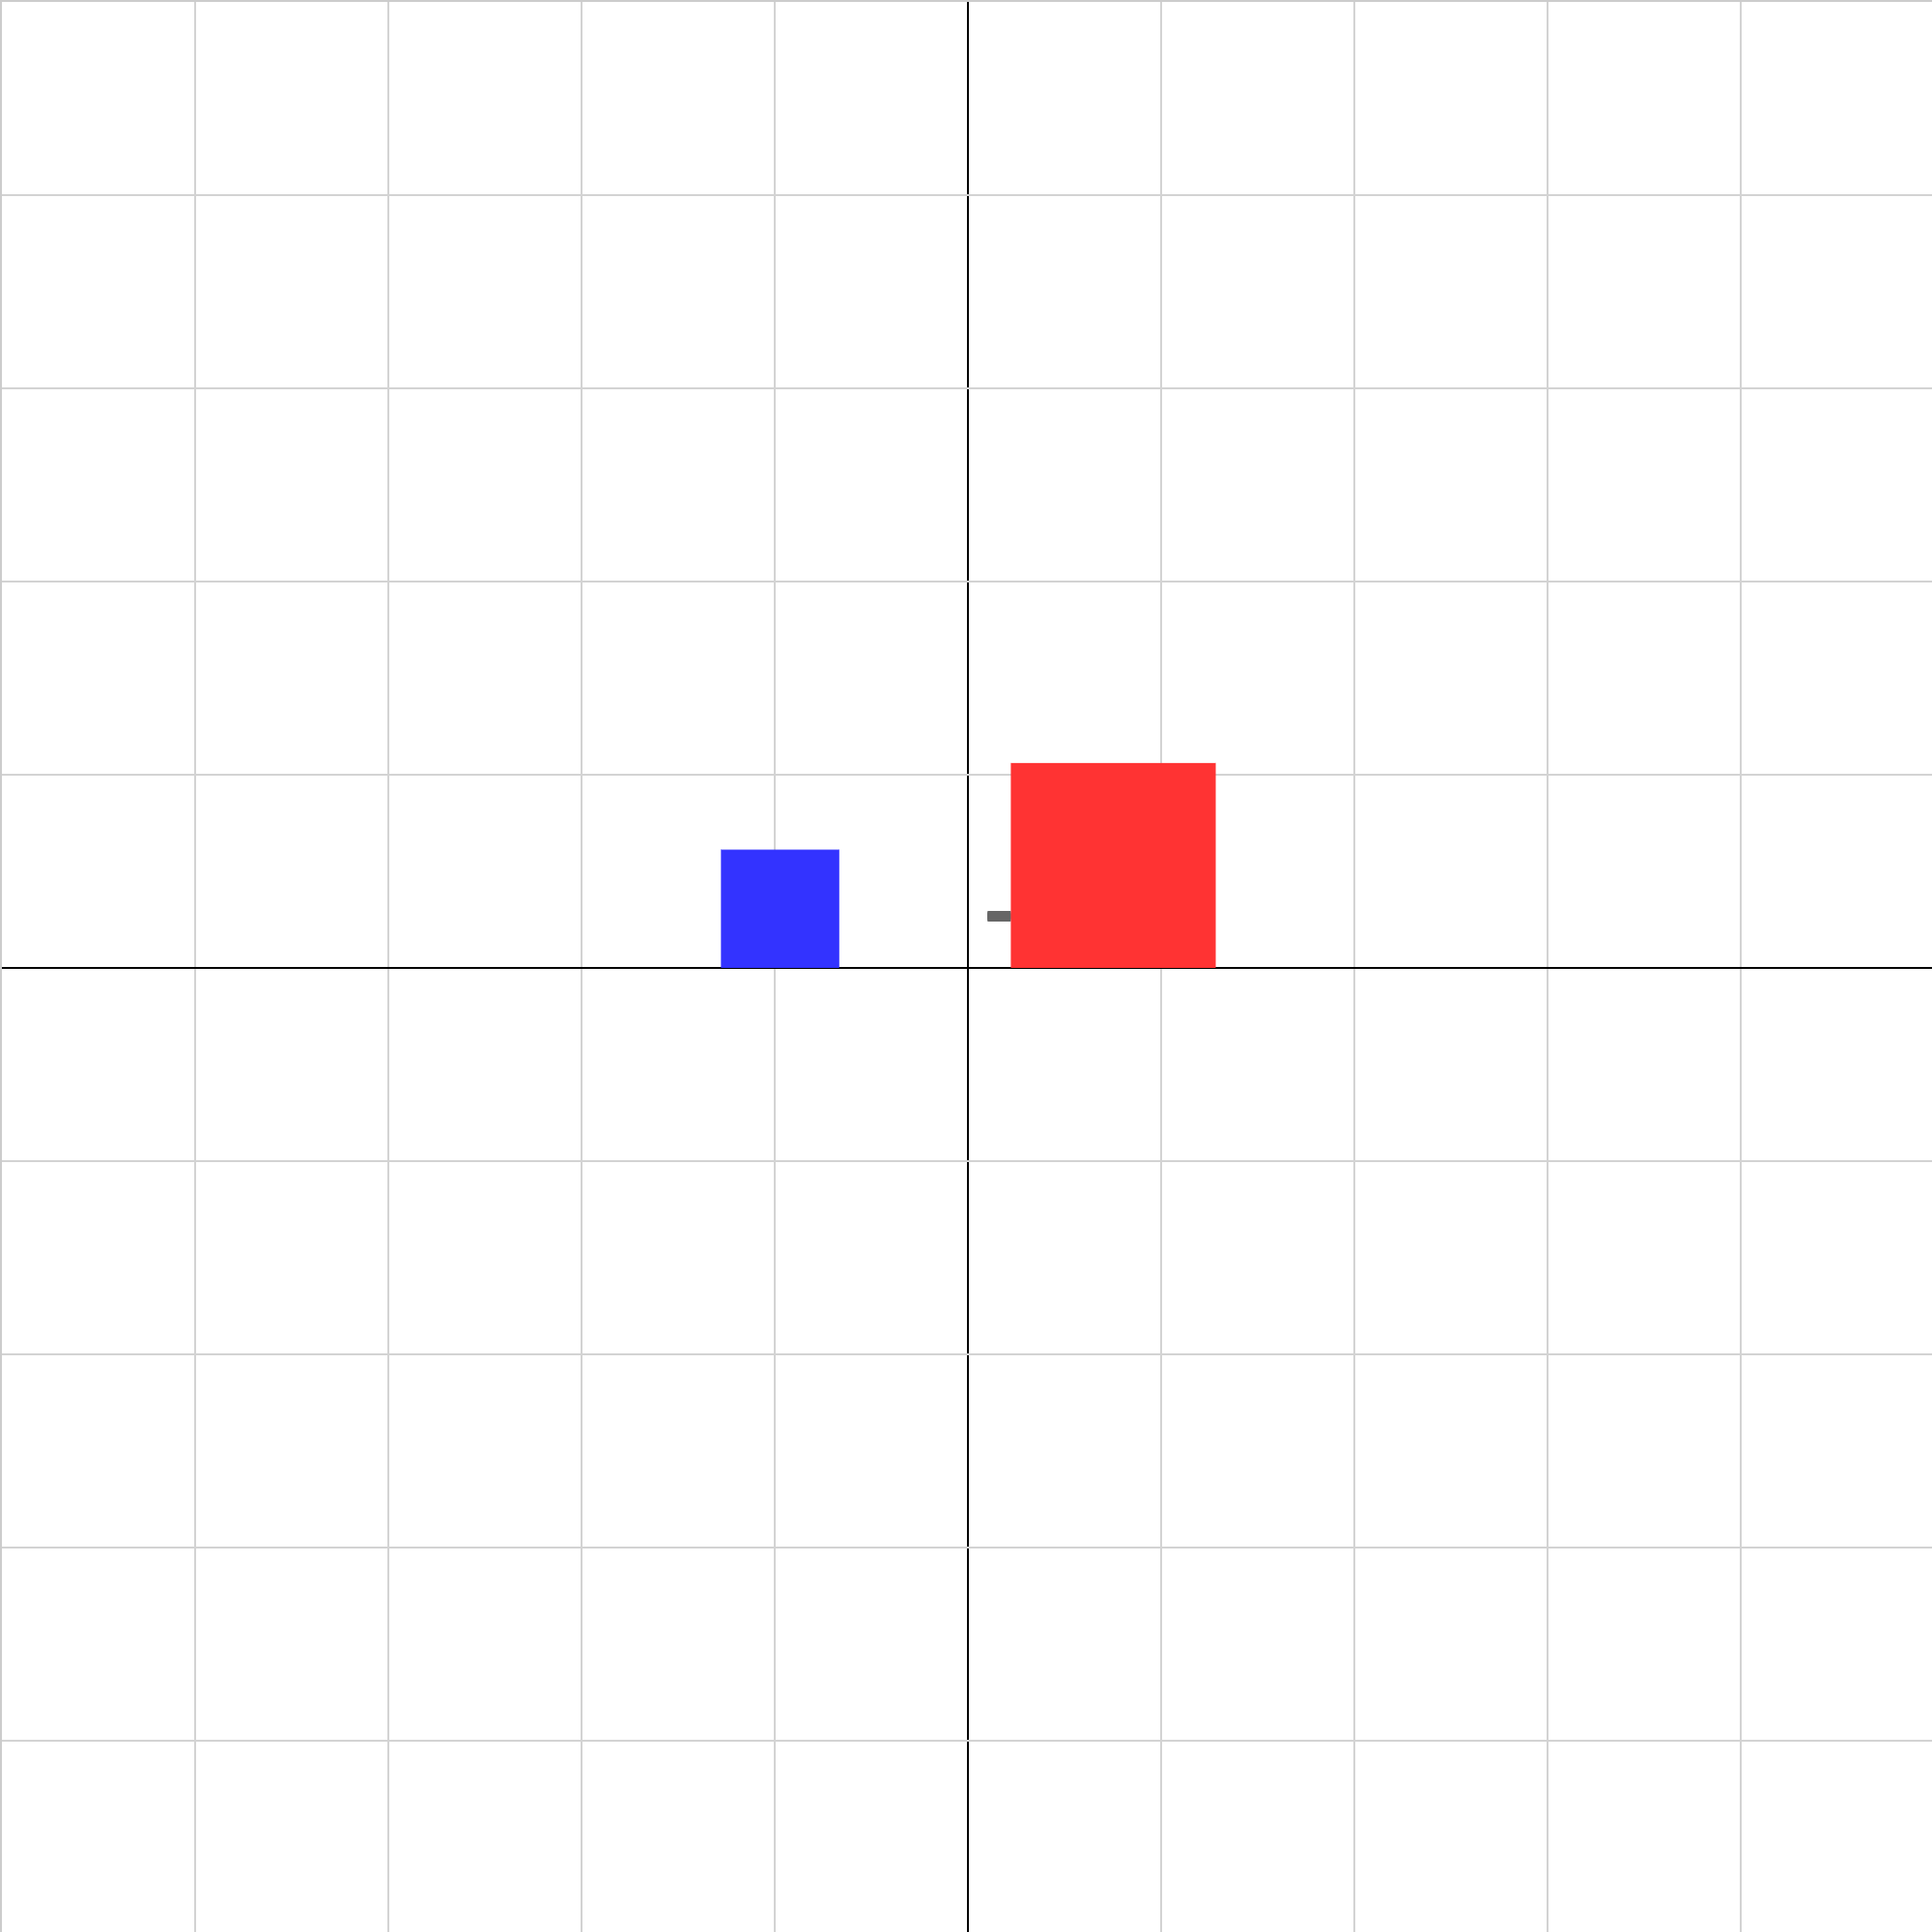
collision-inelastic-04a.iwp
One object moving left collides with another moving right. They stick together in the collision. The animation stops as the collision starts. Use conservation of momentum to predict the velocity after collision of the combined blocks. Momentum is a vector, so you have to take into account the direction of the velocity. Also sketch the velocity vs. time graph for the objects.
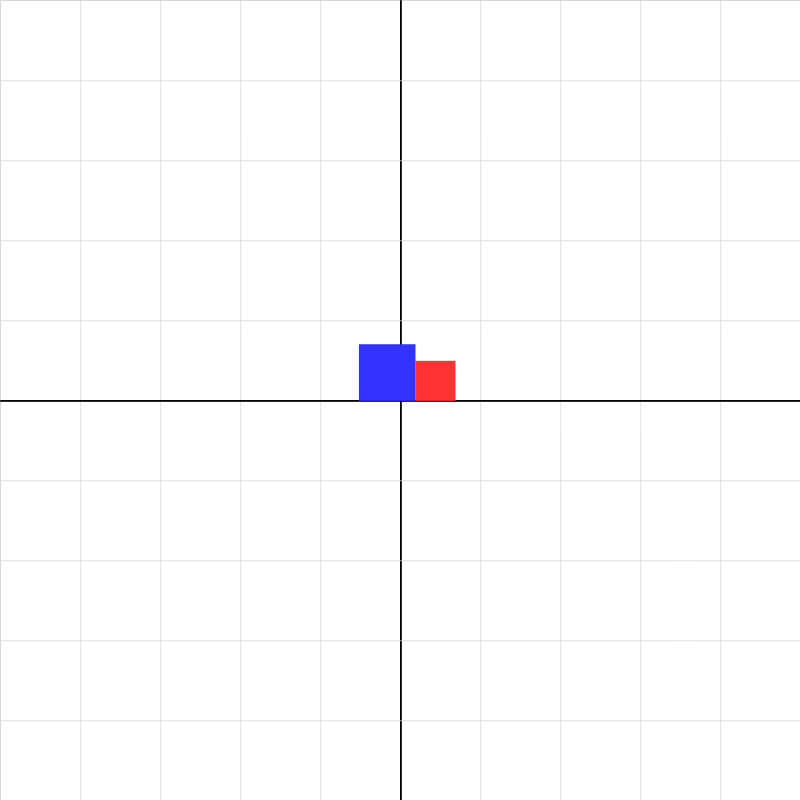
collision-inelastic-05.iwp
Create a collision where the combined blocks move to the left after the collision. You can change masses, positions, and initial velocities. After changing the inputs, click the Reset button before playing. Use conservation of momentum to verify the final velocity. Record your data and results.
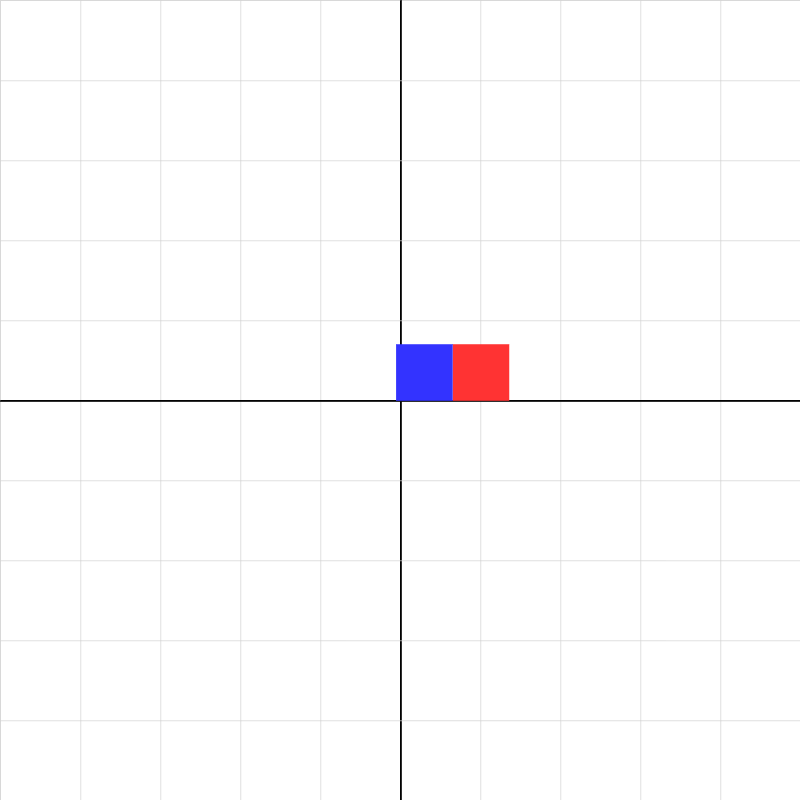
collision-inelastic-06.iwp
Two objects collide and stick together. Determine the ratio of the masses of the blocks.

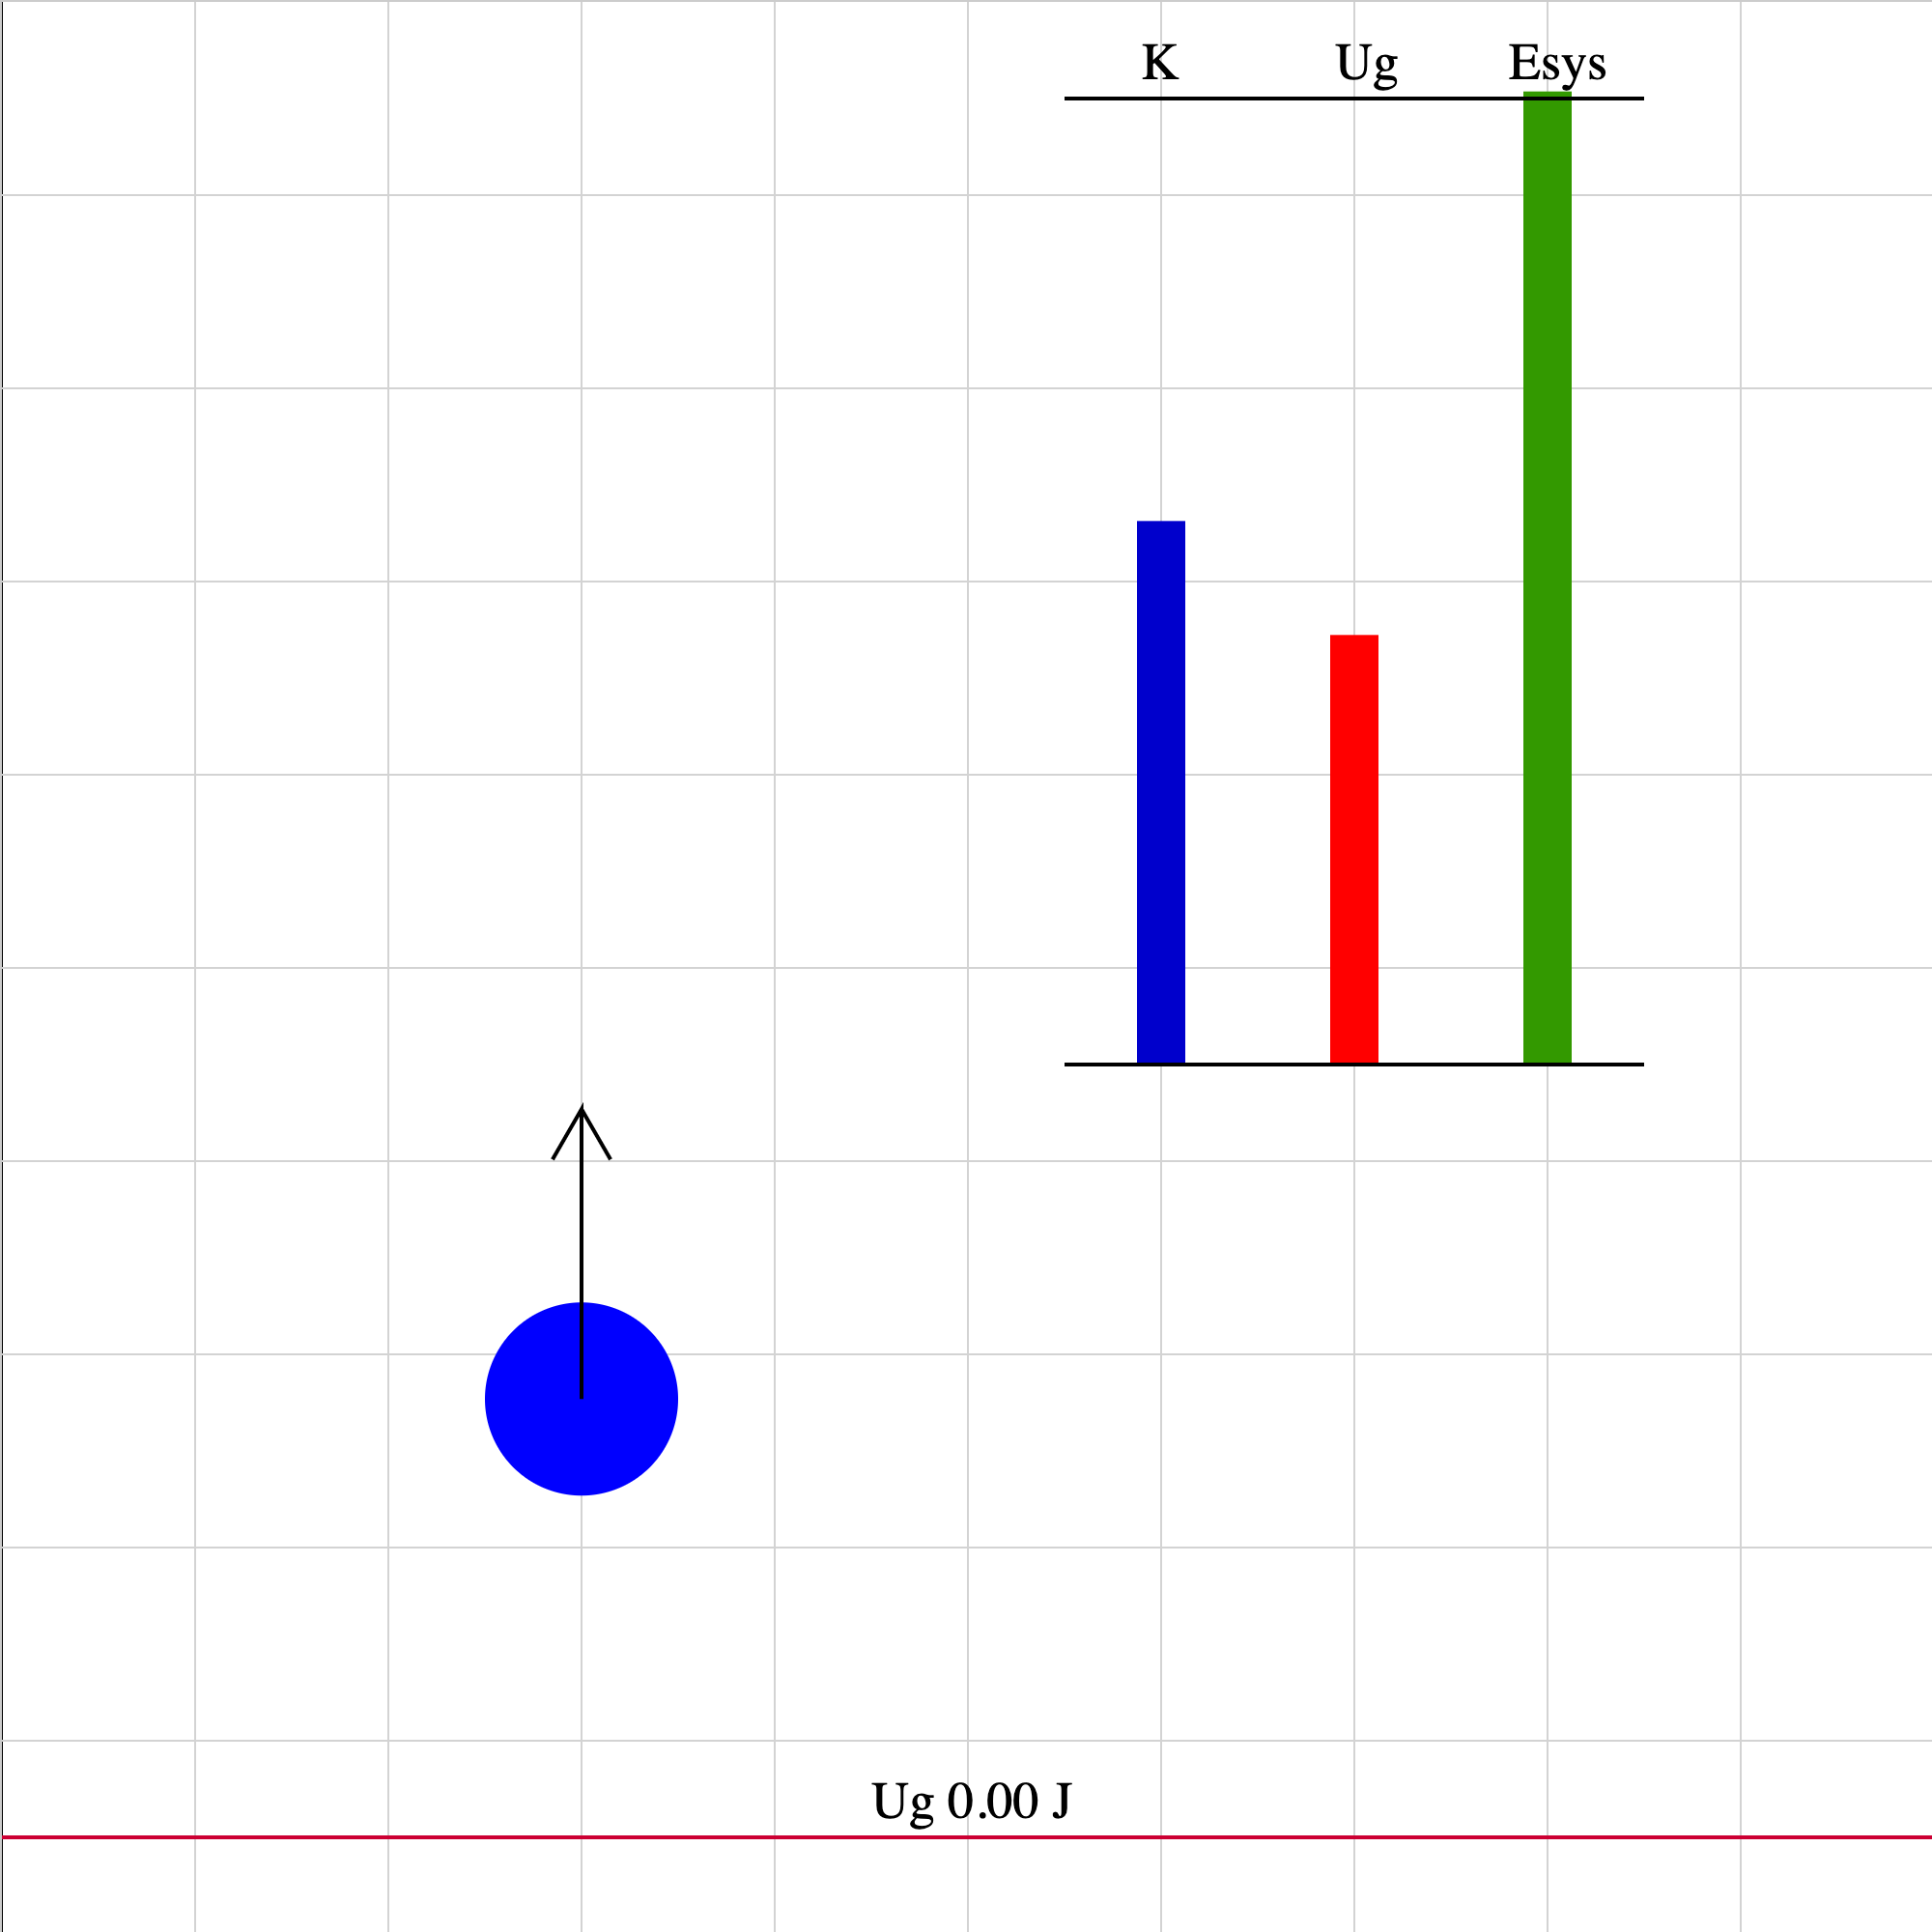
energy-fall-01.iwp
A ball is tossed upward in the absence of air friction. The situation depicted is for times after the upward push force is no longer acting on the ball. The vector shown represents the velocity of the ball. The 0 level for gravitational potential energy is taken to be the initial position of the ball. The system is taken to be the ball and the Earth. The values of kinetic energy, gravitational potential energy, and energy of the system are shown by the vertical, colored bars.
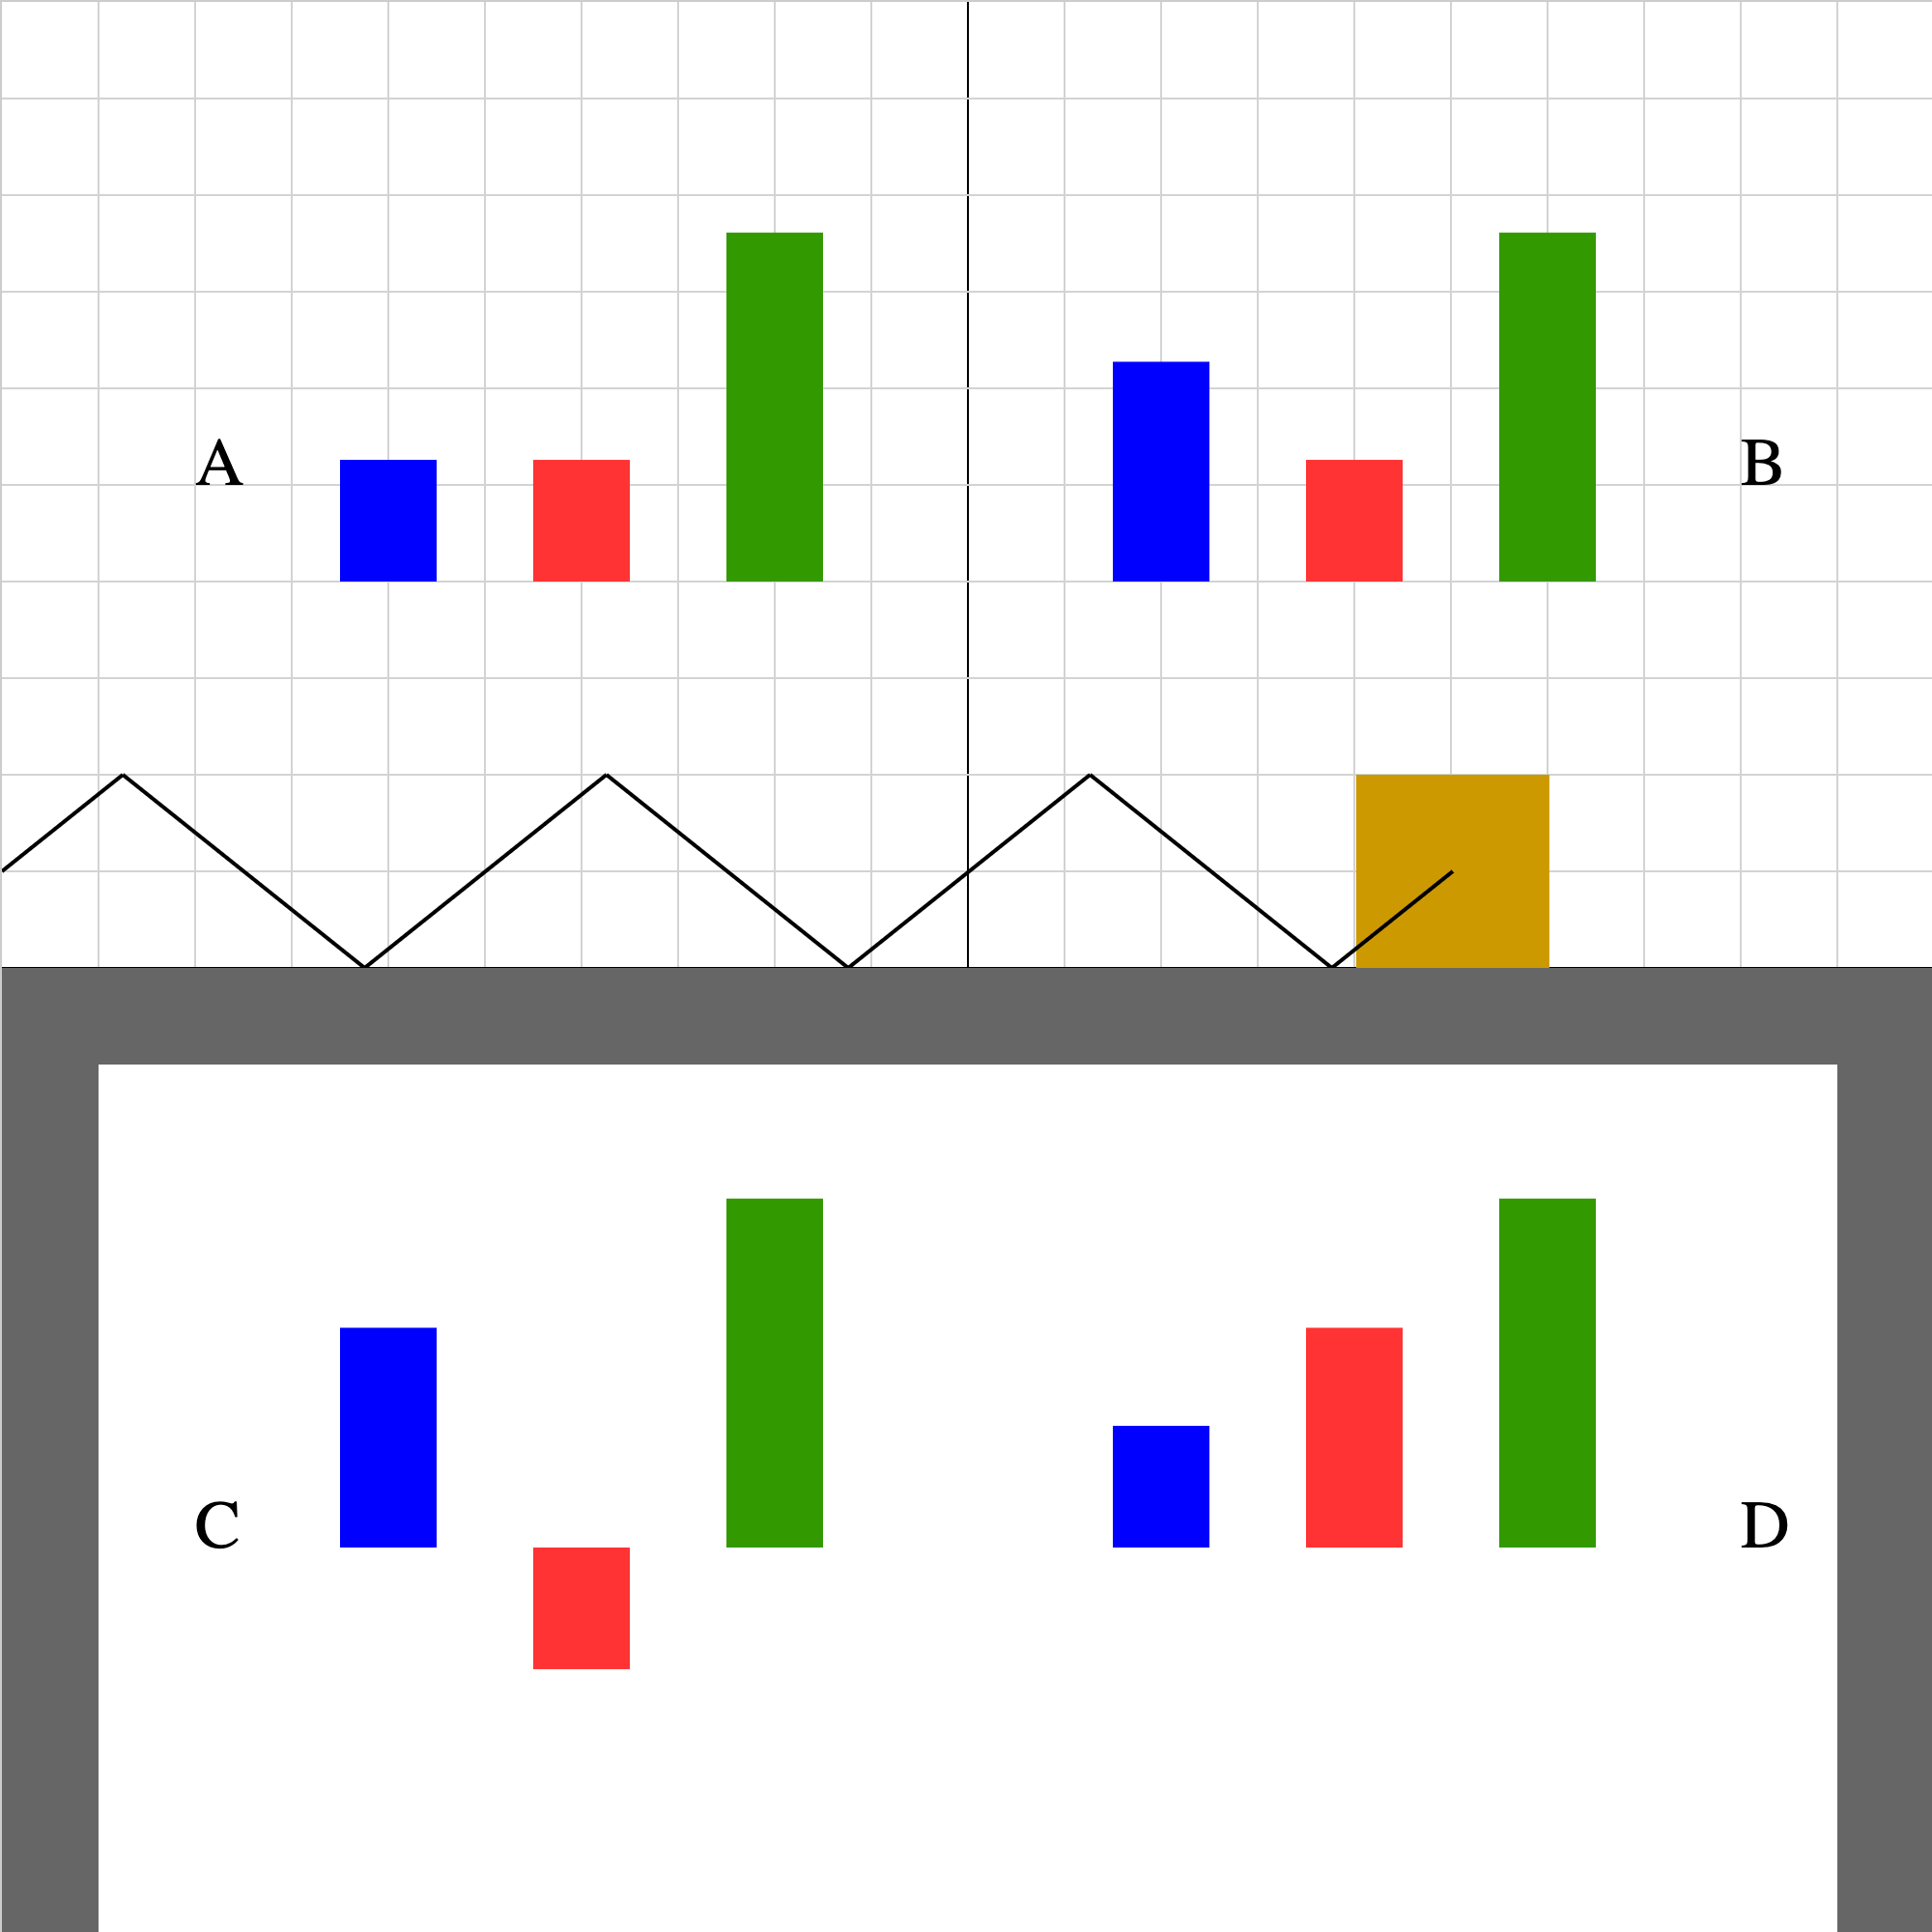
energy-spring-1b.iwp
When you play the animation, the block oscillates horizontally about the origin on a frictionless table. The origin is in the center and the direction of +x is to the right. The oscillation is the result of a Hooke's Law force applied by the spring to the block. The system is taken to be the block and spring. (Gravitational and normal forces do no work on the block.) Which one of the energy bar diagrams (A,B,C,D) represents how the kinetic energy (blue), elastic potential energy (red), and total system energy (green) change as a function of time?
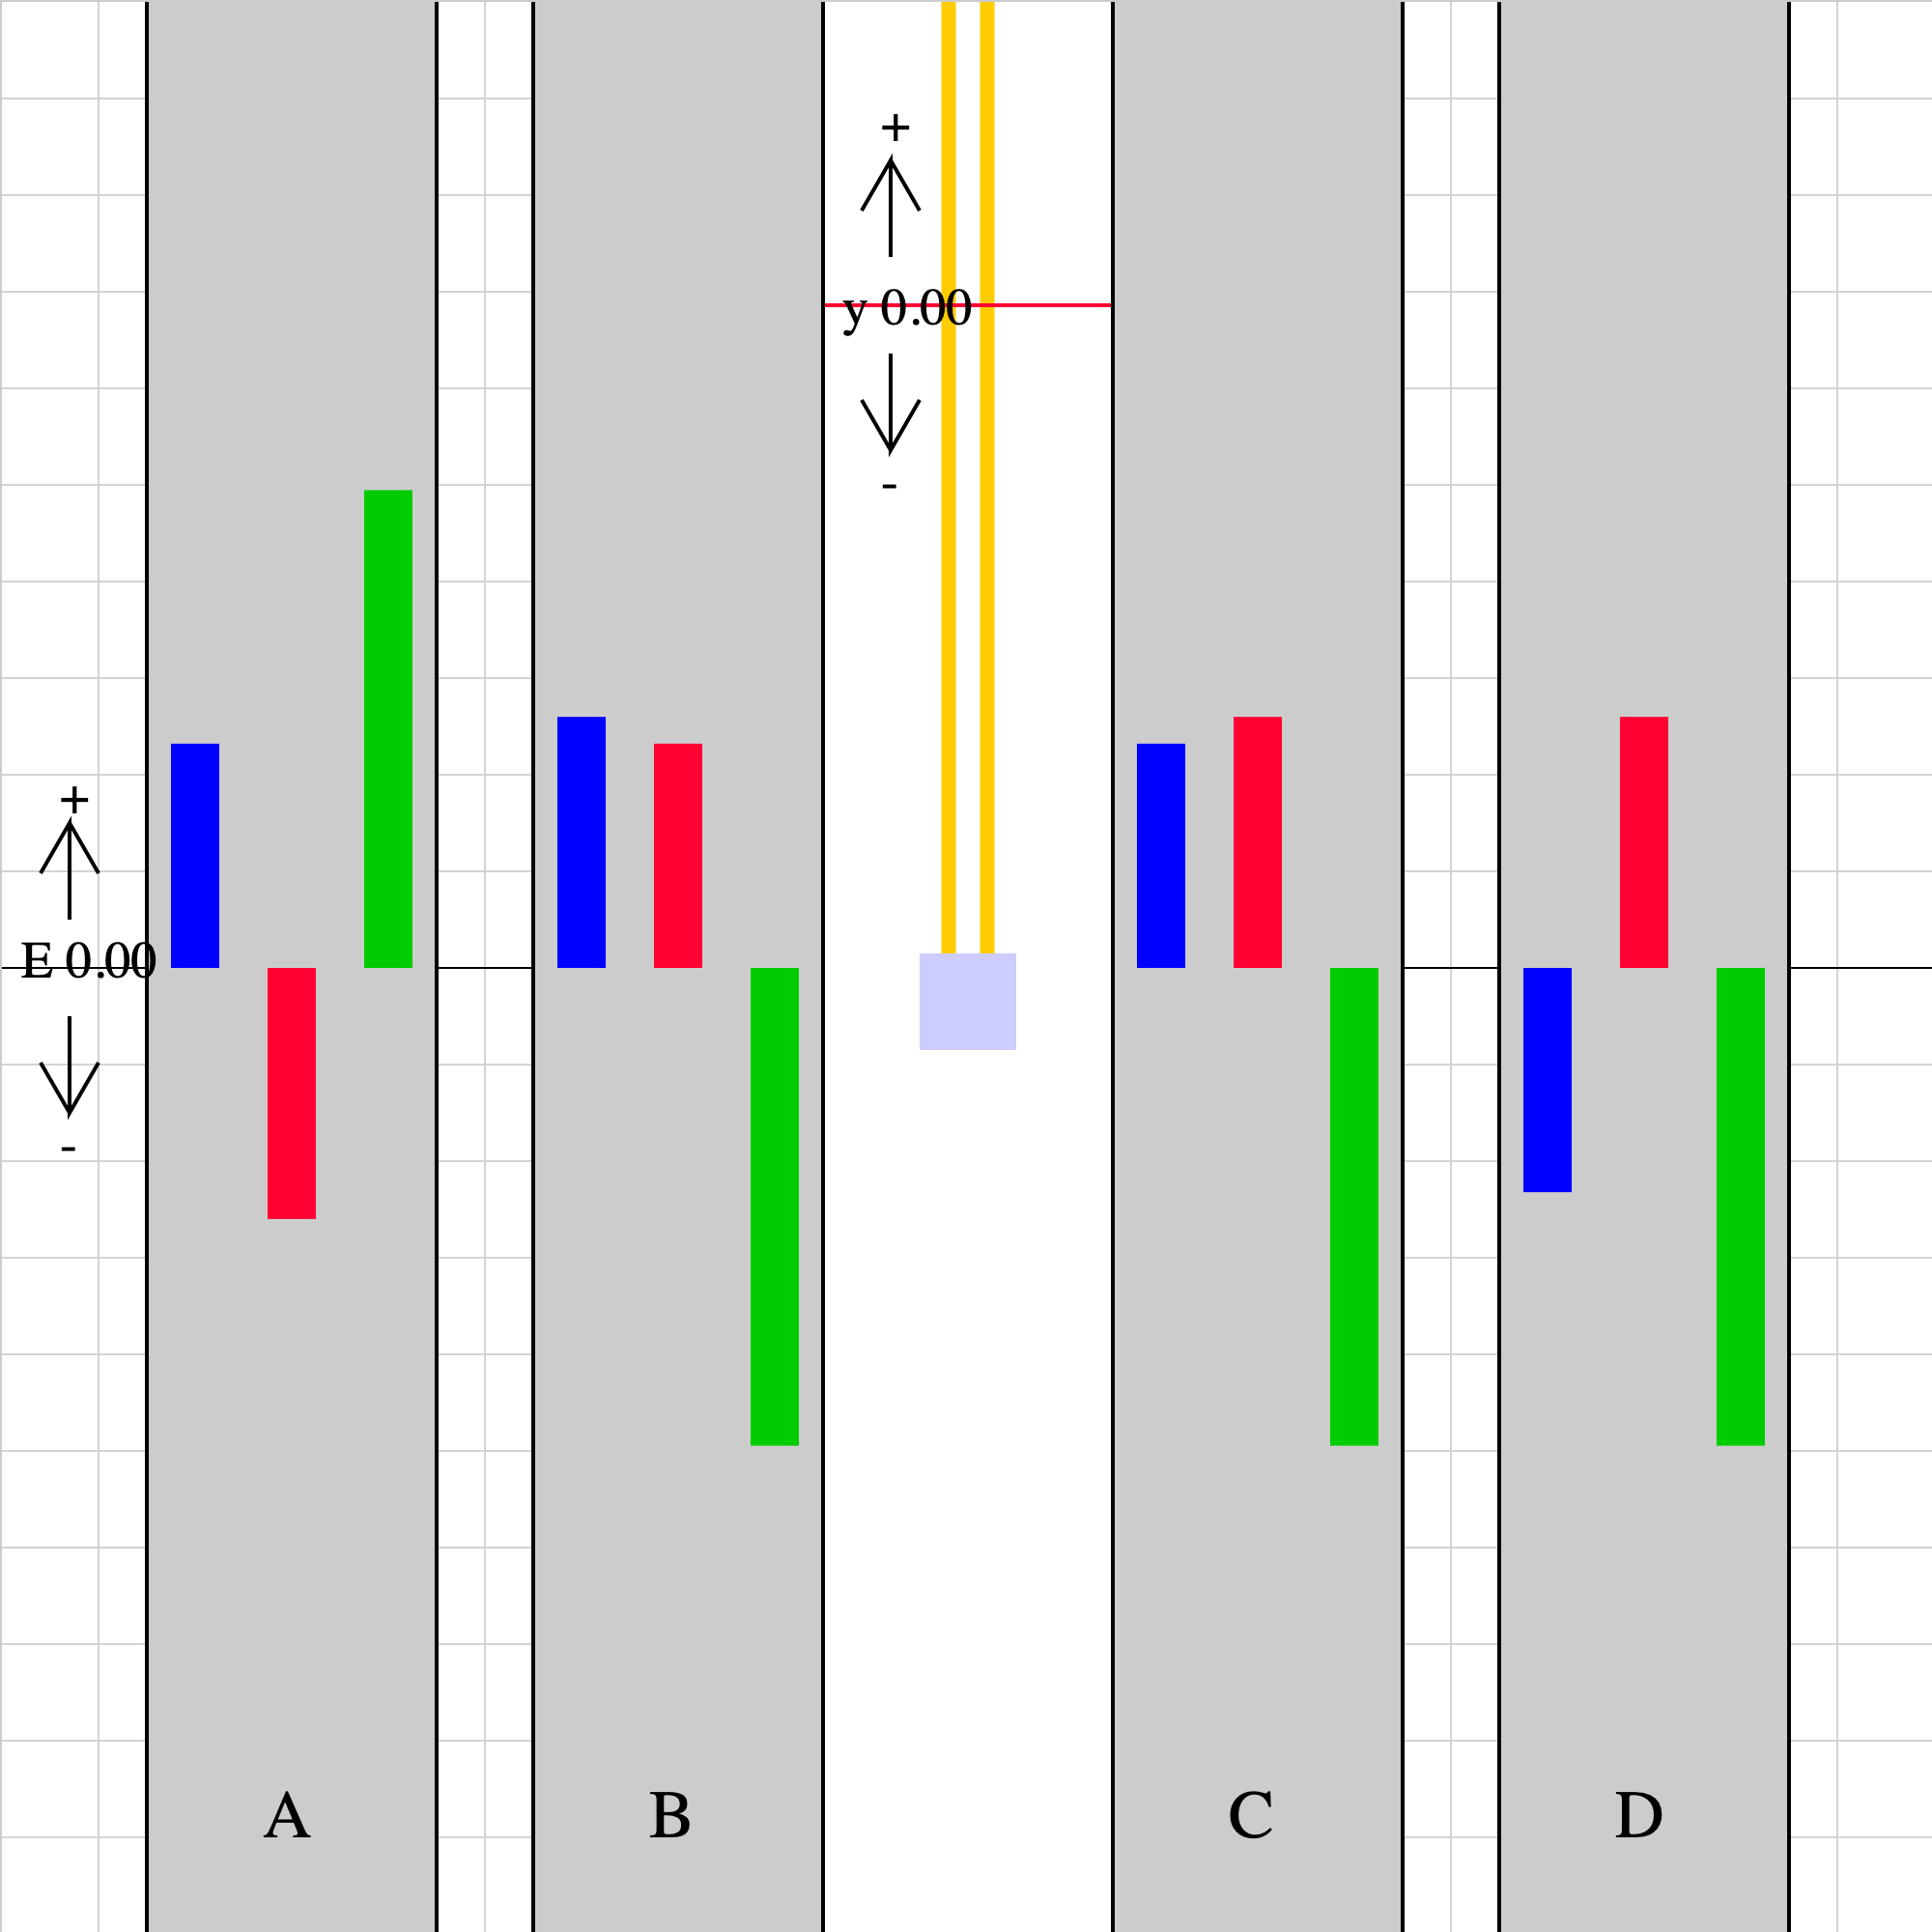
energy-vertspring-01.iwp
A block is suspended from a fixed support by a rubber band. When held in place by the green stick, the rubber band is completely relaxed. When the green stick is pulled away, the block oscillates vertically under the action of gravity and a Hooke's Law type spring force. The red line (marked y = 0) is the position at which both gravitational and elastic potential energy are taken to be 0. The system includes the block, Earth, and band. No external forces act on the system. (Scroll down.) When you play the animation, 4 sets of blue, red, and green bars labeled A-D will appear. One of these sets represents the kinetic (blue), elastic potential (red), and gravitational potential (green) energies. Which set is the correct one? (Note the indicator of positive, 0, and negative energy shown to middle left.)
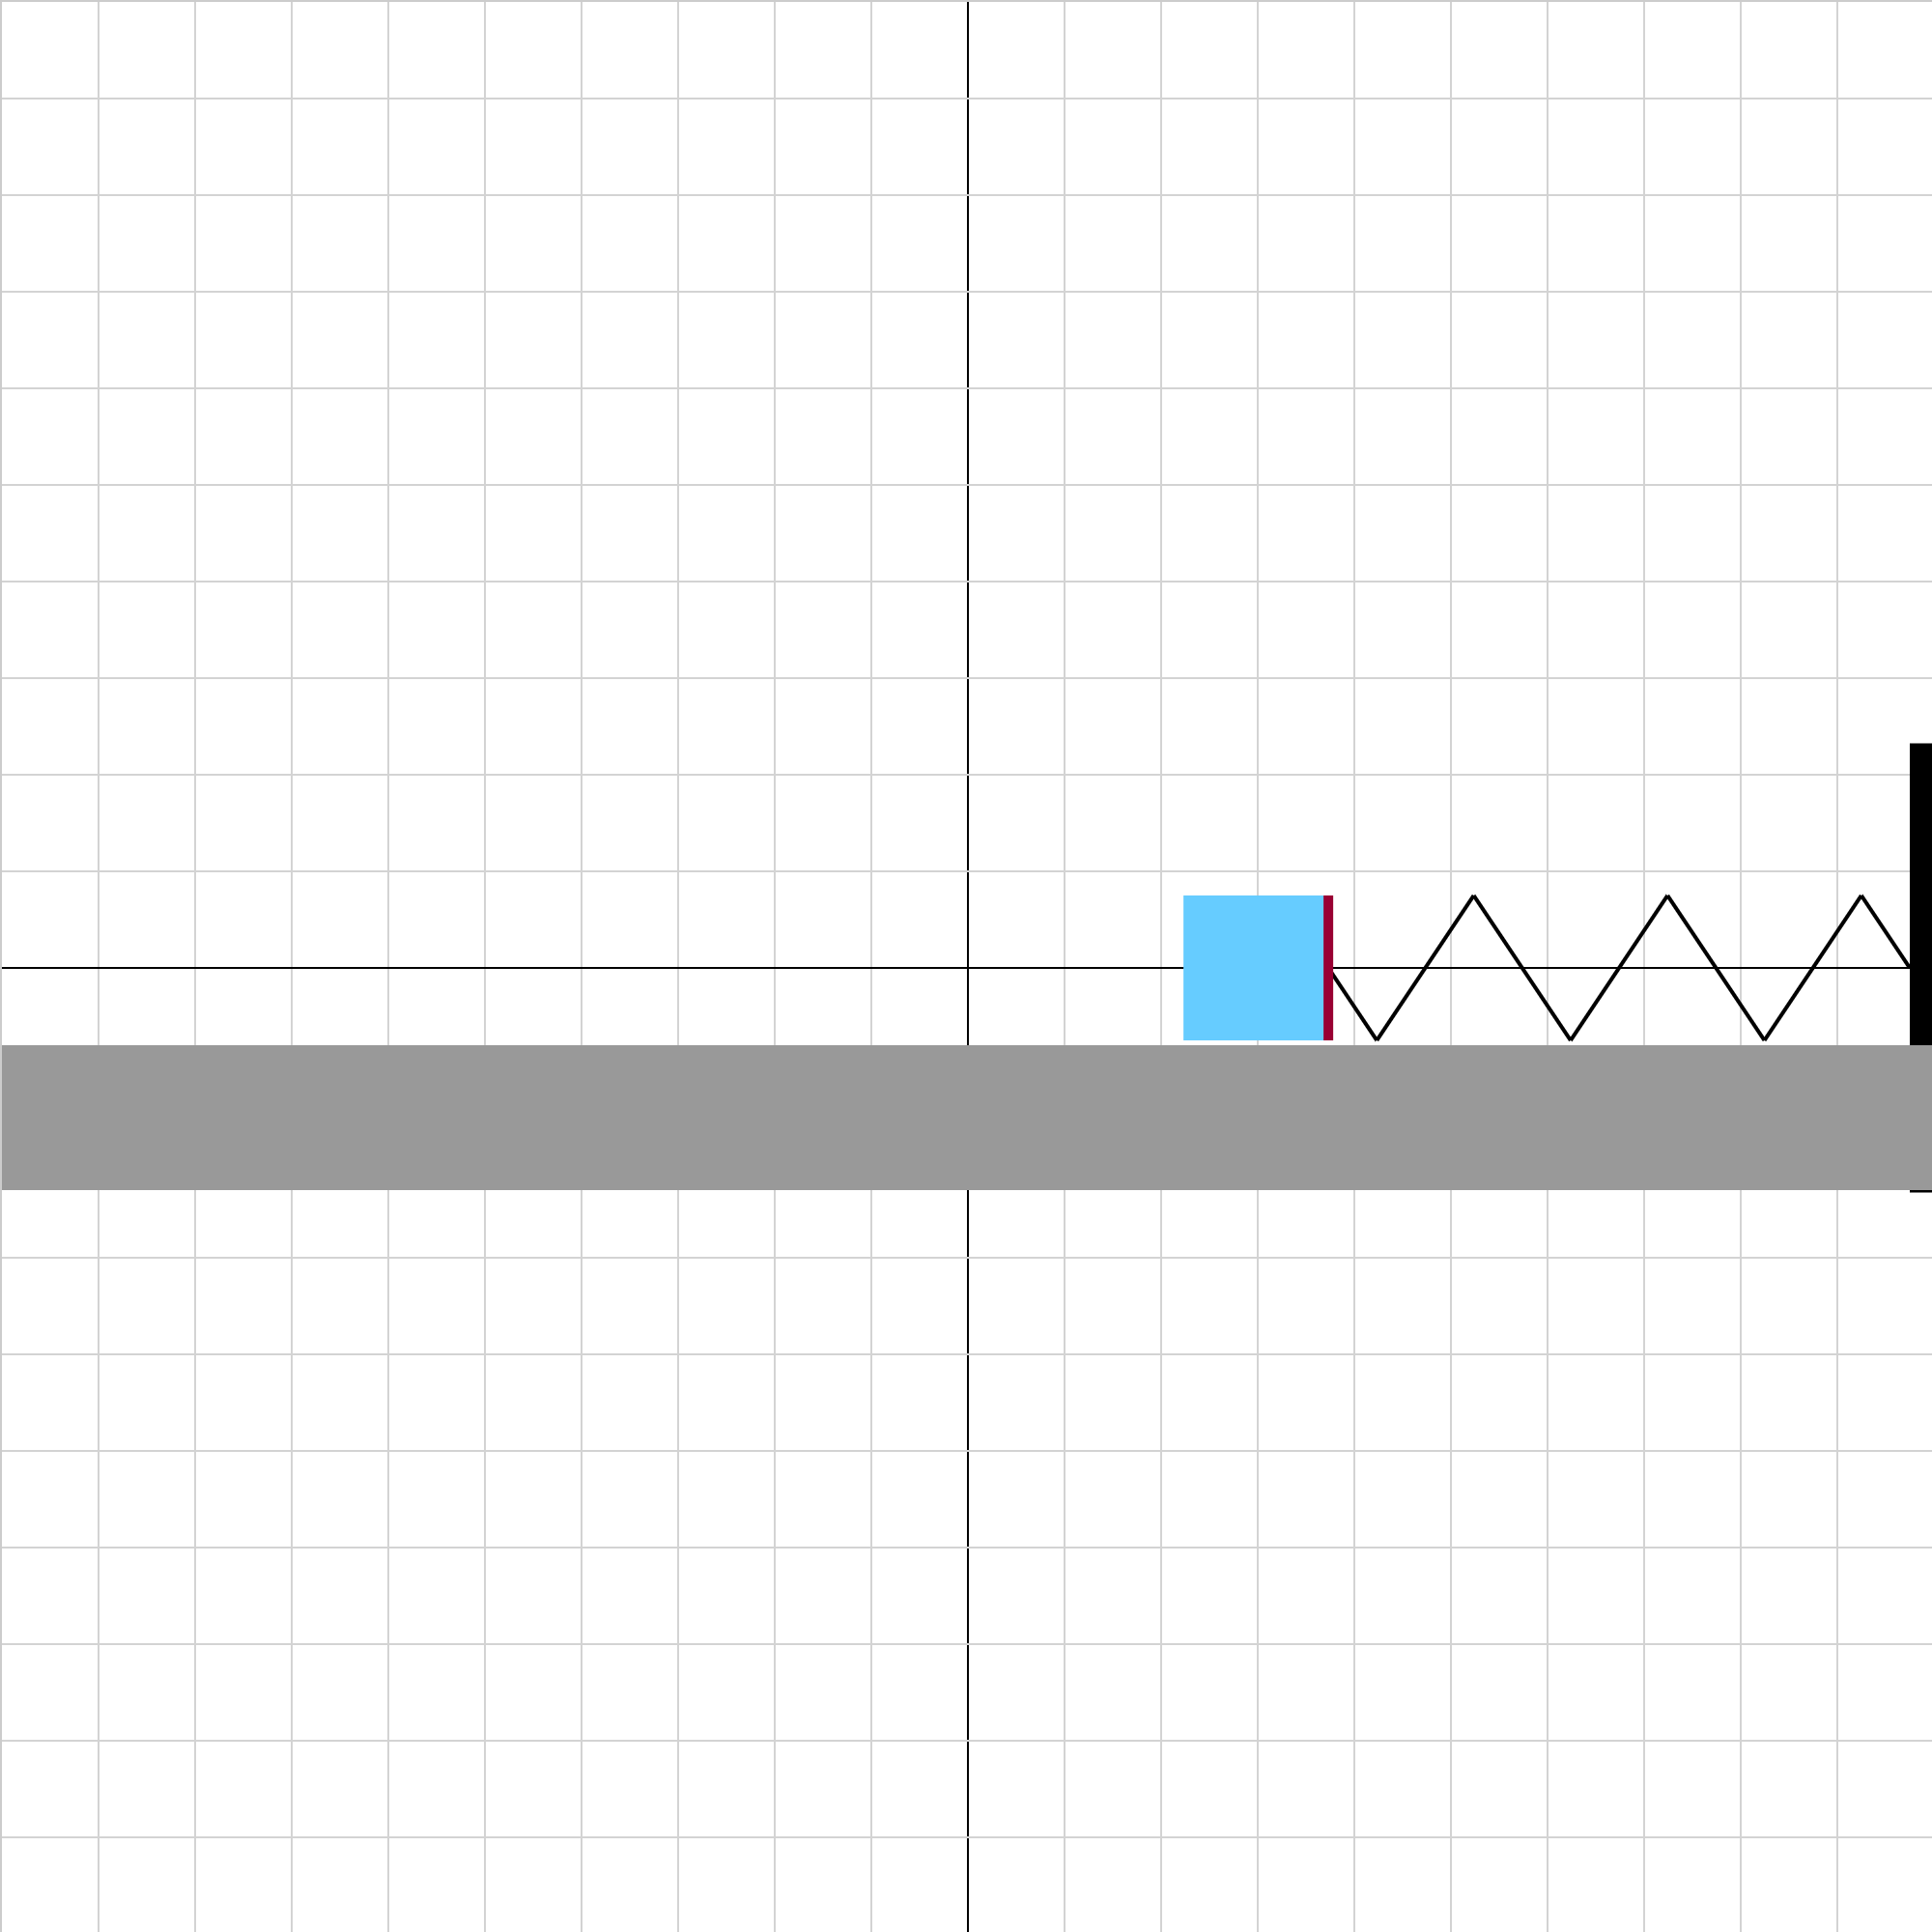
spring_work-03.iwp
A block slides frictionlessly toward a relaxed spring. As the block compresses the spring, the spring does work on the block, bringing it to a stop. Determine the spring constant of the spring. Caution: Unphysical results (such as the block passing through the wall) may be result from some combinations of initial velocity and mass. In such cases, one simply imagines that the spring and support extend further to the right. The block will always return, given enough time.
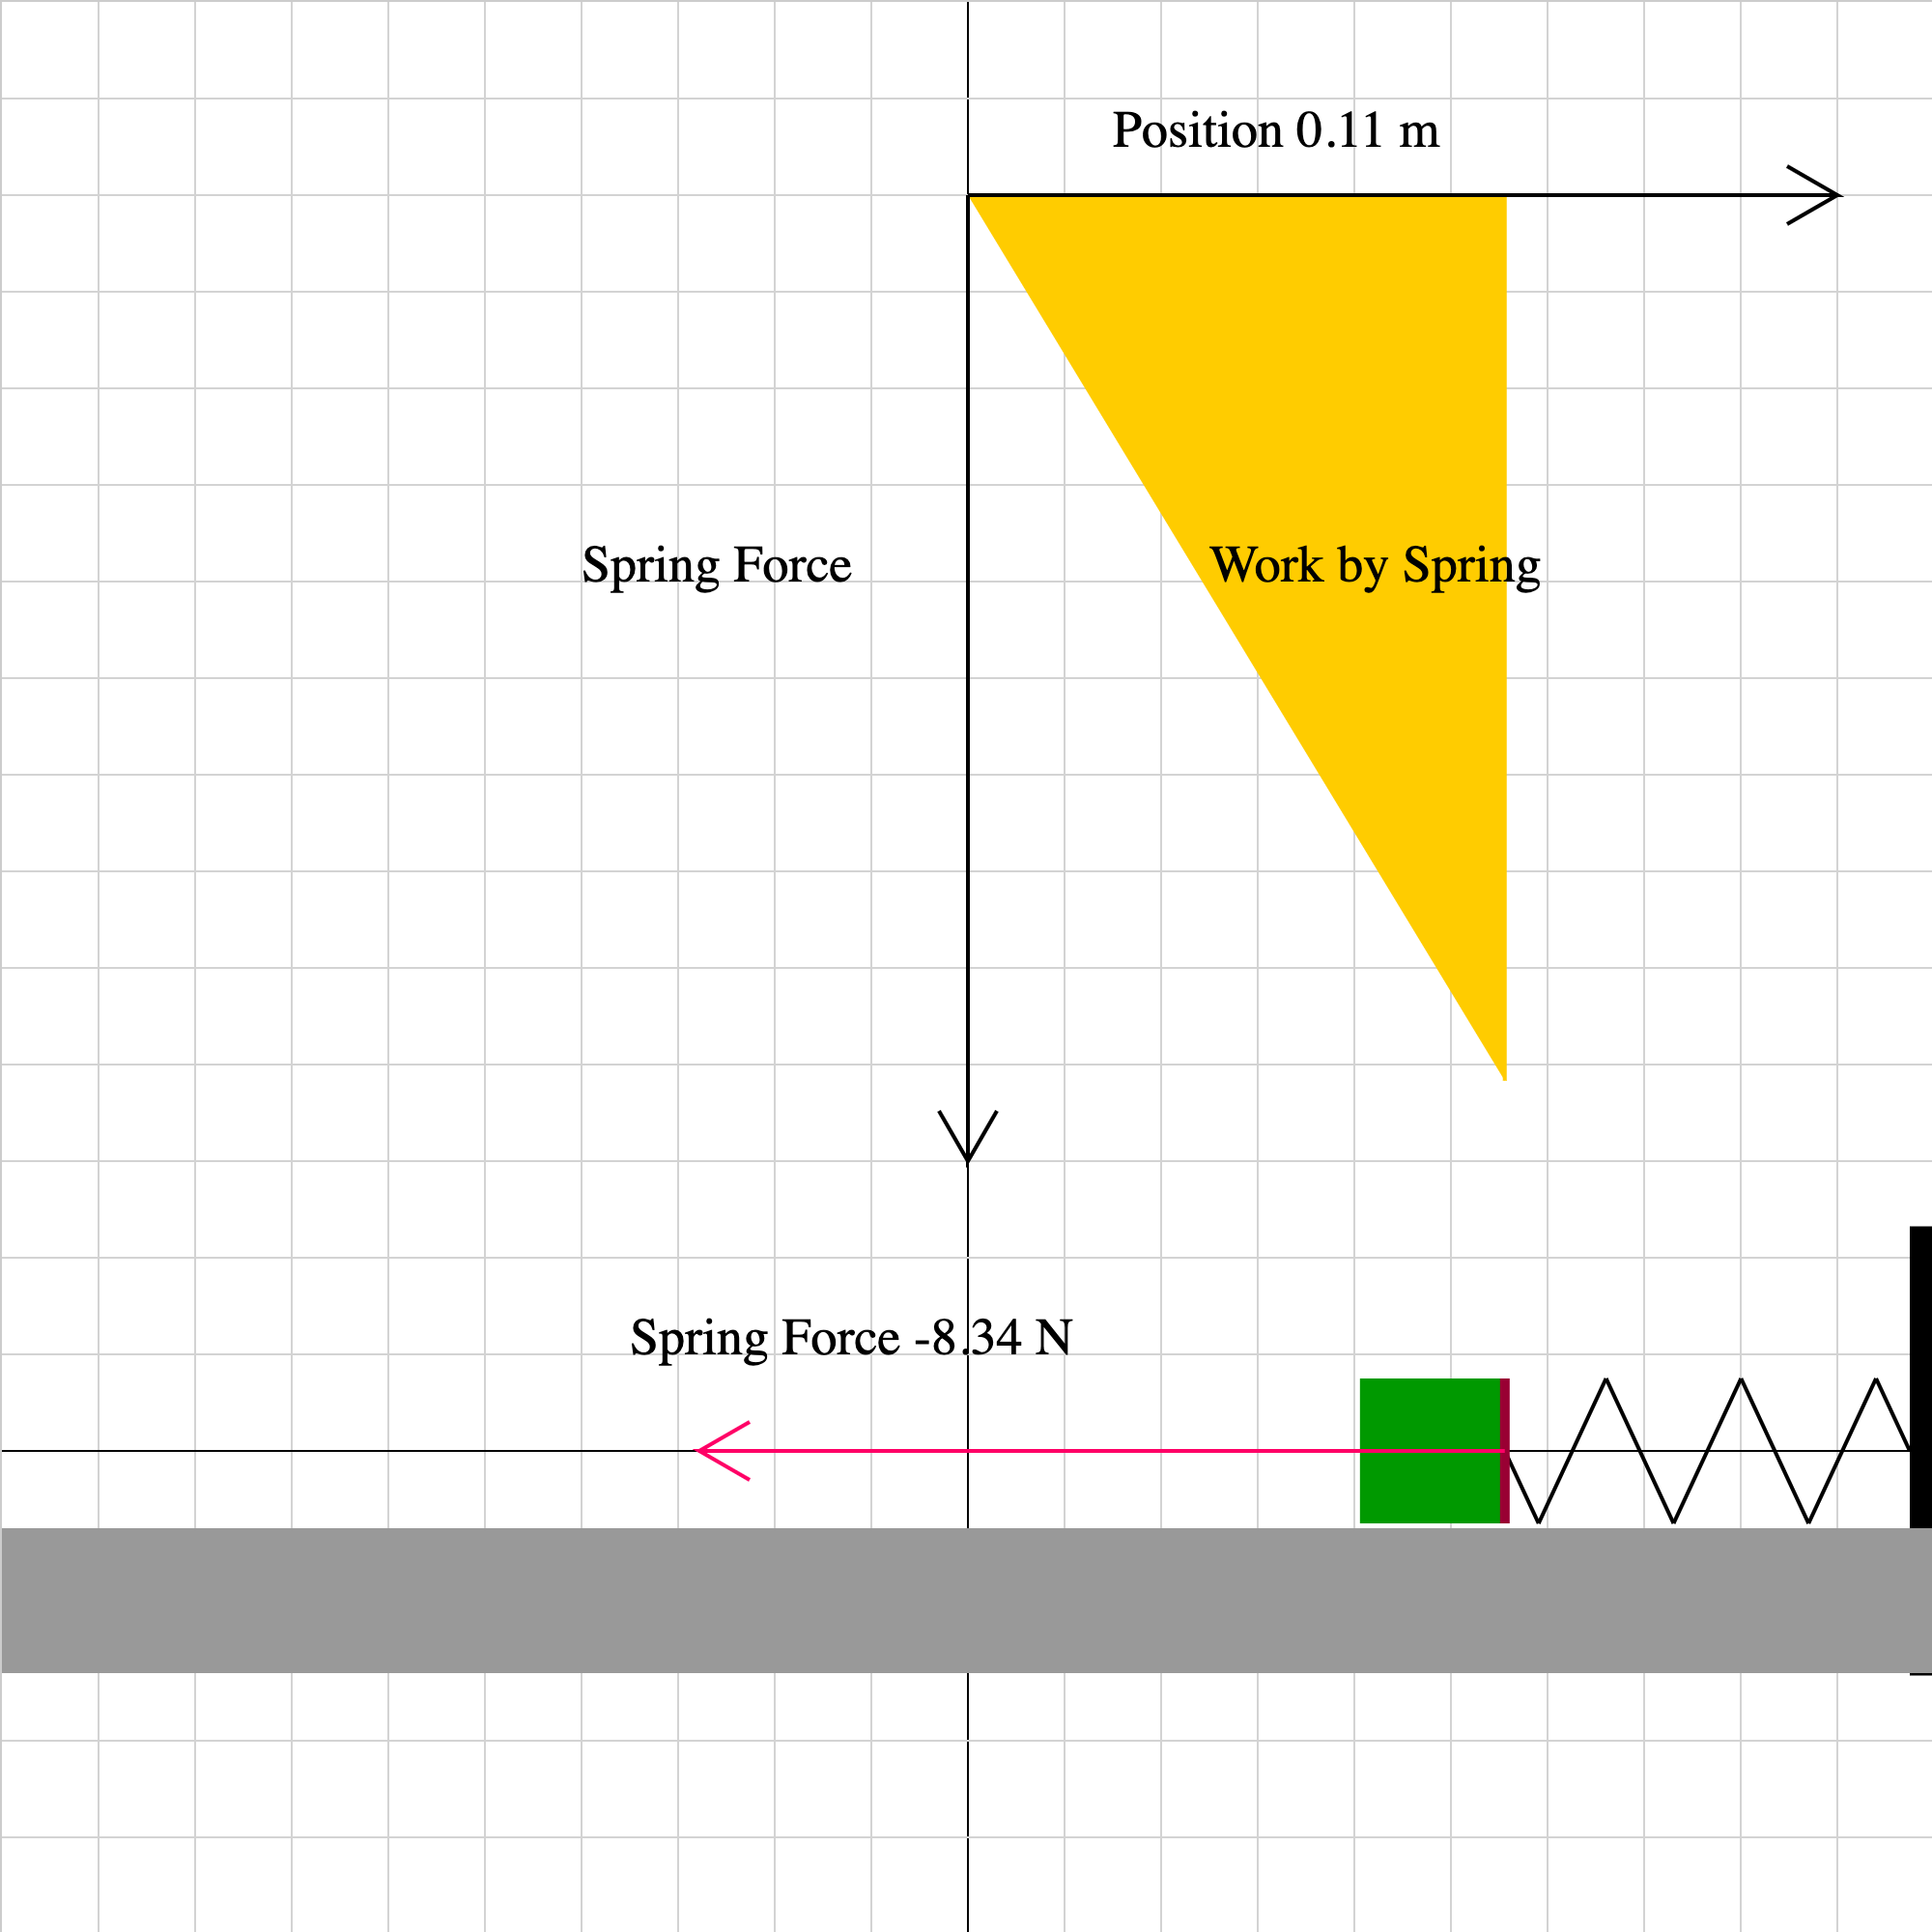
spring_work-04.iwp
A block slides frictionlessly toward a relaxed spring. As the block compresses the spring, the spring does work on the block. A vector representing the spring force is shown as well as a graph of the spring force vs. position. The yellow area under the line is the work done by the spring force.